Prerequisite: Planning 2 or dean's permission
Units: 3.0
Classroom: online via Microsoft Teams
Class Time: Thursday: 9:30 AM-12:30 PM
Office Hour: Thursday: 12:30 PM -12:45 PM - Right after class time
Instructor: Zhuo Yao, Ph.D.
Instructor: Archt. Carmela C. Quizana
Instructor:Zhuo Yao Ph.D.
Instructor: Archt. Carmela C. Quizana
The terms "policy" and "planning" are used very loosely and are frequently interchangeable in many transport studies. Mixing them together is misleading. Policy and planning represent separate parts of an overall process of intervention. There are circumstances where policy may be developed without any direct planning implications, and planning is frequently undertaken outside any of direct policy context. However, precise definitions are not easily come by. The following definitions are here used:
Transport policy deals with the development of a set of constructs and propositions that are established to achieve particular objectives relating to social, economic and environmental development, and the functioning and performance of the transport system.
Transport planning deals with the preparation and implementation of actions designed to address specific problems.
The goal of transport policy is to make effective decision concerning the allocation of transport resources, including the management and regulation of existing transportation activities. Thus, transport policy can be concomitantly a public and private endeavor, but governments are often the most involved in the policy process since they either own or manage many components of the transport system and have levels of jurisdiction on all existing transportation modes. Governments also often perceive that it is their role to manage transport systems due to the important public service they provide in addition to impose a regulatory framework. Yet, many transport systems, such as maritime and air transportation, are privately owned. There are however substantial geographical variations in ownership with the United States having an history of private involvement while Europe, China, India and Japan have more relied on public ownership and operations. In all cases, the common rule is that the public sector usually provides transport infrastructure and the regulatory framework, while the private sector assumes the operations of many modes.
With globalization and deregulation, the private sector has much leverage into the policy process through its asset allocation decisions, which reflects in new public transport policy paradigms.
A major distinction between the planning and policy is that the latter has a much stronger relation with legislation. Policies are frequently, though not exclusively, incorporated into laws and other legal instruments that serve as a framework for developing planning interventions. Planning does not necessarily involve legislative action, and is more focused on the means of achieving a particular goal, often within the existing regulatory framework.
Transport planning focuses upon the public provision and financing of transportation assets, particularly roads and public transit systems.
It is usually addresses specific problems or broad transport concerns at a local level. It has been traditionally a preoccupation of lower tier governments, such as the state or municipality. Because of this fact, transport planning is most developed in the urban sphere, and it is there where most experience has been gathered. The planning process, however, has a number of similarities with the policy process. Identifying a problem, seeking options and implementing the chosen strategy are essential steps in planning too. Because it tends to deal with localized problems, the solutions adopted in transport planning tend to be much more exact and specific than policy directives.
The common perspective is that planning is the realm of the public sector, although the private sector owns and operate substantial transportation assets. For a long time been planning was a field dominated by traffic engineers who gave it a distinctly mechanistic character, in which the planning process was seen as a series of rigorous steps undertaken to measure likely impacts and to propose engineering solutions. There were four major steps: Trip generation, trip distribution, modal split, and route selection. They involved the use of mathematical models, including regression analysis, entropy-maximizing models, and critical path analysis.
There are many reasons why the results of these models should be treated with caution:
They are only as good as the data they manipulate and many times the data is inaccurate or incomplete.
They are based on assumptions that the mathematical relationships between variables remain constant.
They can be manipulated to produce the outcome that would be the most preferred by the actors promoting a policy or a project.
Because the predictions were rarely subjected to subsequent evaluation, their validity is largely questioned, and the modeler is happy to predict the future since projections rarely question the validity of the methodology.
The predictions of future traffic flows produced by the four stage sequence are then used to identify planning options. Since the most common prediction of the modeling is that present capacities will be unable to cope with traffic growth, the tendency has been to produce planning solutions that call for an expansion of capacity. This has been referred to as predict and accommodate. It is the solution that has typified so much urban transport planning from the 1940s to the 1980s. It has given rise to the enormous expansion of highway construction that reinforces the dominance of the automobile. Rarely are there post mortems of the prediction models, and as has been learned by empirical observation, the issue of induced demand has distorted the actual traffic.
In cities traffic problems have increased significantly since the 1970s, despite a great deal of urban transport planning. There is a growing realization that perhaps planning has failed and that the wrong questions have been asked. Rather than estimate traffic increases and then provide capacity to meet the expected growth, it is now accepted that what is required is better management of the transport system through new approaches to planning. Just as urban planning requires the inputs of many specialists, transport planning is beginning to utilize multi-disciplinary teams in order to broaden the scope of the planning process. Planning is still a multi-step process, but it has changed considerably:
Planning is commonly scale specific and multidimensional.
In rejecting the former paradigm of building capacity, transport planners have turned increasingly to managing both demand and the transport system. Building roads has produced a car-oriented society in which the other modal alternatives have little opportunity to co-exist. Car ownership is beyond the ability of the transport planner to control directly and the question remains if it should. But car use and ownership is affected by land use and density, both elements that planners can affect. High population densities, in particular, favor walking, bicycling and public transit use. It is for this reason that a great deal of attention in planning is being paid to densification and integration. This includes concentrating development along well served transport corridors (transit oriented development) and increasing densities in areas undergoing rehabilitation.
Managing the demand for transport is made up of a large number of small interventions that cumulatively can impact of car use, but in particular improve the livability of cities. A sample of well-practiced and successful interventions includes:
While planning interventions may have a positive cumulative effect in shaping transport demand, some economists suggest that a more direct approach involving imposing more stringent cost measures on car users is necessary. It is widely accepted that car users pay only a small proportion of the actual costs of their vehicle use. Economists argue that the external costs should be borne by the users. As intuitively rational as this argument may be, there are several problems with its application:
The effectiveness of economic controls is evident by the experience of Hong Kong, where, despite high incomes, car ownership and use remains at a very low level. This is due in the main to the high cost of parking. An even more drastic example is Singapore, where extreme measures limiting car purchases, high vehicle licenses, electronic tolls on highways, and cordon pricing in the downtown area have restrained car use.
The use of pricing mechanisms may be less in other countries, but the trend towards greater application of some forms of tolling is accelerating. Cordon pricing has been applied in a number of jurisdictions where access to certain areas, usually the CBD, is tolled. The most famous application was the decision to charge private vehicles for entry into Central London in early 2003, a program that has proved to be successful, despite a great deal of opposition.
Another form of charging is the imposition of tolls on new highways and bridges. In North America, the public had become used to the notion that highways are ‘free’, a legacy of the Interstate Highways Act, funded largely by Congress. In both Canada and the US legislation now permits private companies to build and operate private roads and bridges, and to collect tolls to cover costs. In Canada, Highway 407 outside Toronto and the Confederation Bridge linking Prince Edward Island to the mainland are examples of tolled facilities developed and operated by private corporations. The same trend applies to developing countries such as China where many new roads and bridges are toll based.
Another form of pricing is congestion or "fair" pricing. Here certain lanes of a highway are tolled, but at variable rates. When traffic is moving freely, the charges for the tolled lanes are nil. But as traffic builds up and speeds are reduced, the costs of using the reserved lanes increase. Collection of the tolls is electronic, and drivers are informed of the current charges by large signs. Drivers are given a choice therefore, to stay in the slower lanes for free, or move to the tolled lanes at a cost that is proportionate to the speed on the congested lanes. This system is now in place in several US States, after successful tests in California and Texas.
Source: Introduction to Transportation Planning- Information Tools for Tribal Governments, FHWA
| Sector | Categories |
|---|---|
| Regulatory Policy | Financial regulation; Antitrust laws and regulations; Effective legal enforcement; Product liability laws; Tort law; Ease of doing business |
| Infrastructure Policy | Water; Transportation; Electric; PPP; Broad investment support |
| Labor Policy | Wages; Benefits; Labor unions; Workplace safety; Discrimination; Severance; Worker rights |
| Science & Technology | Intellectual property; Information security; Technology transfers; Investment & support |
| Economic Development | Export-import bank; Export incentives restrictions; Strategic industries; Small & medium-sized enterprises; Special economic zones |
| Energy & Environmental Policy | Conventional energy; Alternative energy; Energy efficiency; Energy security; Environmental regulation and compliance |
| Tax Policy | Corporate taxes; Individual taxes; Dividend and capital gains taxes; Tax incentives; Value-added taxes; Offshore taxes |
| Trade Policy | Trade agreements; Tariffs, taxes, quotas & duties, Single window trade system |
| Education, Talent & Innovation | Investment/support for science; Visas and immigration; Labor retention; Training; Certification |
| Health care | Access to health care |
Source: adapted from World Economic Forum (2013) Manufacturing for Growth: Strategies for Driving Growth and Employment.
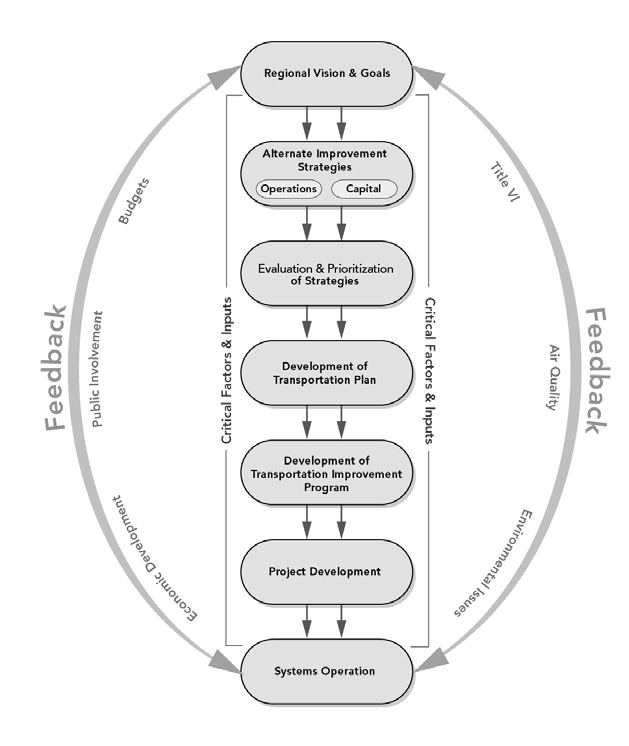
Transportation planning guides the decision making needed to move towards implementation of the envisioned future transportation system. Transportation planning starts with a long-term vision for transportation within the community. Creating this vision can help develop a better understanding of the factors that the transportation system will impact and those factors that may impact the transportation system vision. Planning provides a framework for effective decision making and efficient investment of limited funds.
Developing a Vision
A vision reflects the broad transportation goals and priorities. To develop a vision must consider how growth and other changes over time will affect future transportation needs and priorities such as:
The transportation goals and vision become the foundation for developing a long-range transportation plan (LRTP) which will guide improvements to the transportation system over the next 20 years or more. Goals and visions can be simple, such as improved safety at intersections or improved pedestrian access, or they can be complex, such as improved roadway access to developing lands and to the existing transportation network.
The UPWP lists the transportation studies and tasks that MPO staff and member agencies will perform to support the metropolitan transportation planning process. It must identify the funding source for each project, the schedule of activities, and the agency or agencies responsible for each task or study. UPWPs reflect issues and strategic priorities unique to each metropolitan area and will differ by MPO.
UPWPs cover a one- to two-year period and typically include the following elements:
In metropolitan areas, the MTP identifies how the region intends to invest in the transportation system. Federal law requires the plan, “include both long-range and short-range program strategies/actions that lead to the development of an integrated intermodal transportation system that facilitates the efficient movement of people and goods.”
The MTP is prepared through active engagement with the public and stakeholders using an approach that considers how roadways, transit, nonmotorized transportation, and intermodal connections are able to improve the operational performance of the multimodal transportation system. Accordingly, the MTP must cover performance measures and targets and include a report evaluating whether the condition and performance of the transportation system is meeting those targets.
The MTP may also describe the results of scenario analyses on transportation system conditions and performance. Other information contained in the MTP could include:
In preparing the MTP, the MPO coordinates with the State and public transit operators and makes particular effort to engage all communities and stakeholders. Finally, in cases where a metropolitan area is designated as a non-attainment or maintenance area for a transportation-related pollutant, the MTP must conform to the SIP for air quality (see Air Quality).
MTPs are updated every five years in air quality attainment areas, every four years in non-attainment or maintenance areas, or more frequently in all areas as State and local officials deem necessary.
MPOs use a TIP to identify transportation projects and strategies they will pursue over the next four years. These projects reflect the investment priorities detailed in the MTP. TIPs list the immediate program of investments that, once implemented, will go toward achieving the performance targets established by the MPO and documented in the MTP. In short, a TIP is a region’s means of allocating its transportation resources among the various capital, management, and operating investment needs of the area, based on a clear set of short-term transportation priorities prepared through a performance-driven process. All projects receiving Federal funding must be in the TIP.
Under Federal law, TIPs must follow these rules:
State DOTs cooperate with non-metropolitan area local officials to develop an LRSTP using a performance-driven process based on an agreed upon set of performance measures and targets. Plans are prepared with active engagement with the public and stakeholders and will vary by State. LRSTPs may be either policy-oriented strategic plans, or project–focused investment plans that include lists of recommended projects.
The Statewide plan also addresses:
The State Planning and Research Work Program (SPR) is similar to the UPWP. It lists transportation studies, research, and public engagement tasks that a State DOT, affiliated agencies, or consultants perform to support the Statewide and nonmetropolitan transportation planning process. An SPR work program contains several elements:
The STIP is similar to the TIP in that it identifies the immediate short-range priorities for transportation investments Statewide and must be fiscally constrained. Through an established process, State DOTs work with local officials to identify projects across rural areas, small urban areas called urban clusters—with 2,500 to 49,999 people—and urbanized areas. Projects are selected for the STIP based on adopted procedures and criteria. As noted above, TIPs developed by MPOs must be incorporated, directly or by reference and without change, into the STIP.
Under Federal law and regulation, the STIP:
| Who Develops? | Who Approves? | Time Horizon | Content | Update Requirements | |
|---|---|---|---|---|---|
| UPWP | FHWA/FTA/MPO | MPO | 1 or 2 years | Planning Studies and Tasks | At least once every 2 years |
| MTP | MPO | MPO | 20 years | Future goals, strategies and projects | Every 5 years(4 years for non-attainment and maintenance areas) |
| TIP | MPO | MPO/Governor | 4 years | Transportation Investments | Every 4 years |
| LRSTP | State DOT | State DOT | 20 years | Future goals, strategies and projects | Not specified |
| STIP | State DOT | FHWA/FTA | 20 years | Transportation investments | Every 4 years |
| PIP | State DOT | State DOT | Not specified | Public engagement strategies and goals, incorporating input, responding to comments | Periodic review and update |
| PPP | MPO | MPO | Not specified | Public engagement strategies and goals, incorporating input, responding to comments | Periodic review and update |
FHWA Highway Functional Classification Concepts, Criteria and Procedures
A. The Interstate System
B. Definitions and Characteristics
The previous section provided a general overview of the functional classification categories of Arterial, Collector and Local. For Federal functional classification purposes, this section breaks these categories down further to stratify the range of mobility and access functions that roadways serve. Additionally, the physical layout and the official designation of some roadways dictate the classification of certain roadways.
Relationship between Functional Classification and Travel Characteristics
| Functional Classification | Distance Served (and Length of Route) | Access Points | Speed Limit | Distance between Routes | Usage (AADT and DVMT) | Significance | Number of Travel Lanes |
|---|---|---|---|---|---|---|---|
| Arterial | Longest | Few | Highest | Longest | Highest | Statewide | More |
| Collector | Medium | Medium | Medium | Medium | Medium | Medium | Medium |
| Local | Shortest | Many | Lowest | Shortest | Lowest | Local | Fewer |
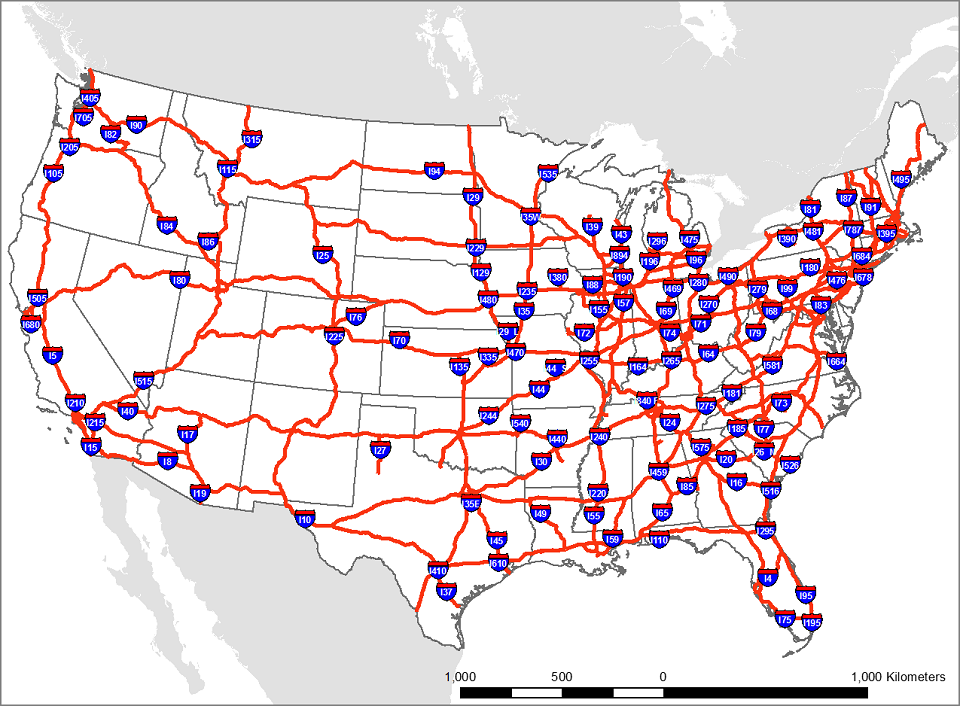
Interstates Interstates are the highest classification of Arterials and were designed and constructed with mobility and long-distance travel in mind. Since their inception in the 1950's, the Interstate System has provided a superior network of limited access, divided highways offering high levels of mobility while linking the major urban areas of the United States.
Determining the functional classification designation of many roadways can be somewhat subjective, but with the Interstate category of Arterials, there is no ambiguity. Roadways in this functional classification category are officially designated as Interstates by the Secretary of Transportation, and all routes that comprise the Dwight D. Eisenhower National System of Interstate and Defense Highways belong to the Interstate functional classification category and are considered Principal Arterials.
Other Freeways & Expressways
Roadways in this functional classification category look very similar to Interstates. While there can be regional differences in the use of the terms 'freeway' and 'expressway', for the purpose of functional classification the roads in this classification have directional travel lanes are usually separated by some type of physical barrier, and their access and egress points are limited to on- and off-ramp locations or a very limited number of at-grade intersections. Like Interstates, these roadways are designed and constructed to maximize their mobility function, and abutting land uses are not directly served by them.
Other Principal Arterials
These roadways serve major centers of metropolitan areas, provide a high degree of mobility and can also provide mobility through rural areas. Unlike their access-controlled counterparts, abutting land uses can be served directly. Forms of access for Other Principal Arterial roadways include driveways to specific parcels and at-grade intersections with other roadways. (Figure 3-2) For the most part, roadways that fall into the top three functional classification categories (Interstate, Other Freeways & Expressways and Other Principal Arterials) provide similar service in both urban and rural areas. The primary difference is that there are usually multiple Arterial routes serving a particular urban area, radiating out from the urban center to serve the surrounding region. In contrast, an expanse of a rural area of equal size would be served by a single Arterial.
Minor Arterials
Minor Arterials provide service for trips of moderate length, serve geographic areas that are smaller than their higher Arterial counterparts and offer connectivity to the higher Arterial system. In an urban context, they interconnect and augment the higher Arterial system, provide intra-community continuity and may carry local bus routes.
In rural settings, Minor Arterials should be identified and spaced at intervals consistent with population density, so that all developed areas are within a reasonable distance of a higher level Arterial. Additionally, Minor Arterials in rural areas are typically designed to provide relatively high overall travel speeds, with minimum interference to through movement. The spacing of Minor Arterial streets may typically vary from 1/8- to 1/2-mile in the central business district (CBD) and 2 to 3 miles in the suburban fringes. Normally, the spacing should not exceed 1 mile in fully developed areas.
Source: Transportation Statistics Annual Report (2012)
Performance Measurement Perspectives
| - | Traffic | Mobility | Accessibility |
|---|---|---|---|
| Definition of Transportation | Vehicle travel | Person and goods movement | Ability to obtain goods, services and activities |
| Unites of Measure | Vehicle miles | Person-miles and ton-miles | Trips, generalized costs |
| Modes Considered | Automobile and truck | Automobile, truck and transit | Automobile, truck, transit,cycling and walking |
| Common Indicators | Vehicle traffic volumes and speeds, roadway level of service, cost per vehicle mile, parking convenience | Person travel volumes and speeds, road and transit level of service, cost per person-mile, travel convenience | Quality of available transportation choices, distribution of destinations, cost per trip |
| Assumptions | Maximum motor vehicle travel and speed | Maximum personal travel and goods movement | Maximum transport choice and cost efficiency |
| Consideration of Land Use | Treats land use as in input, unaffected by transportation decisions | Recognizes that land use can affect travel choices | Recognizes that land use has major impacts on transportation |
| Favored transportation improvement strategies | Roadway and parking facility improvements to increase capacity, speed and safety | Transportation system improvements that increase capacity, speed and safety | Management strategies and improvements that increase transport system efficiency and safety |
| Implications for travel demand management | Generally considers vehicle travel reductions undesirable, except if congestion is extreme | Supports TDM strategies that improve personal and freight mobility | Supports TDM whenever it is cost effective |
Transit Performance (some examples only)
Source: FHWA
Source: FHWA