Prerequisite: Planning 2 or dean's permission
Units: 3.0
Classroom: online via Microsoft Teams
Class Time: Thursday: 9:30 AM-12:30 PM
Office Hour: Thursday: 12:30 PM -12:45 PM - Right after class time
Instructor: Zhuo Yao, Ph.D.
Instructor: Archt. Carmela C. Quizana
Thursday, November 17th, 2022
Instructor:Zhuo Yao Ph.D.
Instructor: Archt. Carmela C. Quizana
| Proposed Special Topics | Count |
|---|---|
| Sustainable Housing and Community Development | 25 |
| Sustainable Transportation Systems | 23 |
| Scenario-based Transportation Planning and Policy Evaluation | 16 |
| Land Use, Transportation, and Air Quality | 15 |
| Travel Demand Modeling | 15 |
| Transportation and Climate Change | 3 |
| Transportation Planning | 3 |
| Urban Problems | 3 |
| Active Transportation and Micro-mobility | 2 |
| Pedestrian-Centric Urban Design | 2 |
| Adaptation to a Changing Climate | 1 |
| Environment-centered Development | 1 |
| Green Urbanism | 1 |
| Sustainable and Efficient Transportation Systems | 1 |
| Urban Planning | 1 |
| Ways in integration of Indigenous Context and Characteristics in the Modernization of Community Planning | 1 |
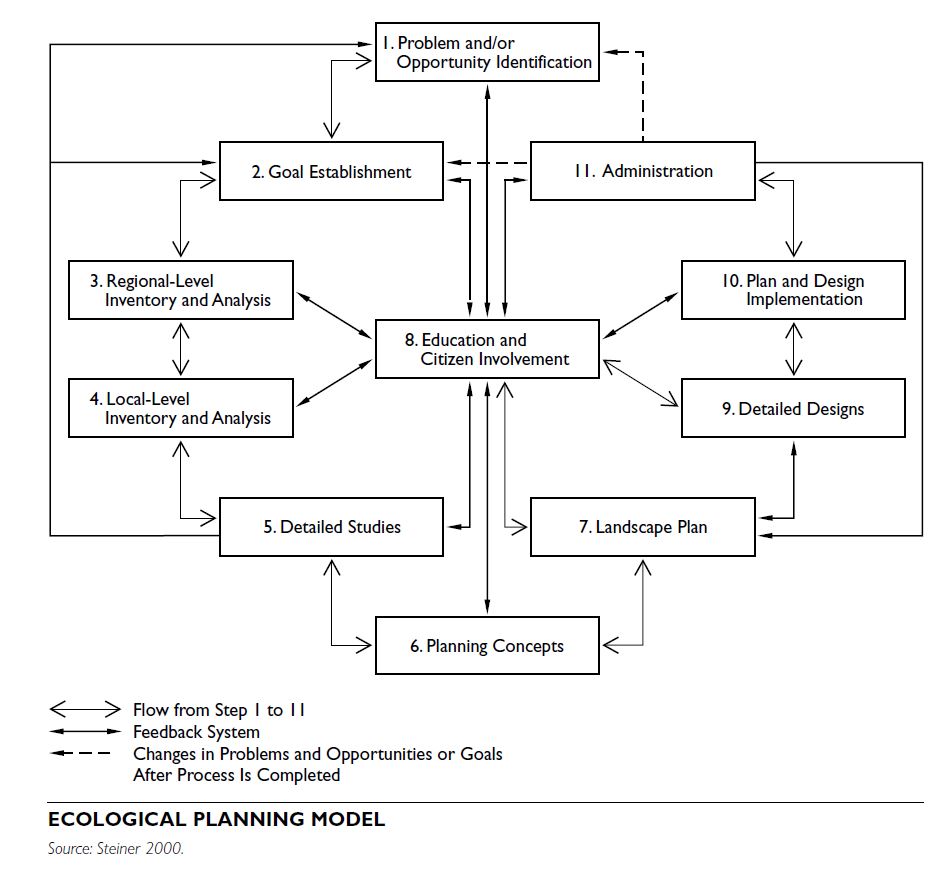
“Environment” refers to our surroundings.
Its meaning is closely related to two other terms used in planning and urban design, “ecology” and “landscape.” Ecology involves the study of the reciprocal relationships of all organisms to each other and to their biological and physical environments. Landscapes comprise the sum of natural and cultural elements seen in a single view. When we add “planning” to each of these terms, the combined term refers to developing future options for our surroundings, for the interrelationships among biological and physical processes, and for the visual manifestation of those relationships.
Because our surroundings contain physical, biological, and built elements,
environmental planning involves using knowledge about those elements to provide options for decision making.
The typical components that need to be considered include physical phenomena, such as air, climate, rocks, terrain, and water; biological elements, such as plants and animals; and the built environment, which encompasses buildings, streets, yards, and parks. Soils are an especially important element because they occur at the interface between physical and bio- logical processes. Some surroundings may appear natural, such as farmlands, but are actually part of the built environment.
COMPONENTS OF THE ENVIRONMENT
The elements and processes involved in environmental planning are complex, hence the ordering of various components is important. Planning theorist Ian McHarg suggested a layer-cake model for such ordering. In this approach, time and ecology were used as organizing devices. Older environmental layers were used to understand younger phenomena. For example, regional climatic and geology processes result in specific physiographic, groundwater, and surface water characteristics. These physical processes create the parent material for soils, which allow specific plants to grow. Animals and people use these plants to live.
These layers can be overlaid in order to understand ecological relationships and to determine suitable land-use possibilities. The concept of layering environmental information provides the theoretical underpinnings for geographic information systems (GIS). Planners and urban designers use GIS maps to explore relationships and patterns, and to determine the possibility of suitability with greater speed and efficiency. The components of the natural environment can be viewed as both sources and sinks for human activity. The environment is a source when it provides resources for people, such as productive soils, drinking water, clean air, timber, and minerals for energy and building. Environments are sinks when they are used as disposals for our wastes.
Natural environments can also pose hazards to human health, safety, and welfare. Some hazards, such as floods, are relatively easy to forecast, while others are more difficult to predict, such as earth- quakes, hurricanes, and tornadoes. Even though difficult to predict, areas susceptible to earthquakes, hurricanes, and tornadoes are well defined by geologists and climatologists. As a result, emergency plans can be prepared and building modifications can be made to minimize the loss of life and property. Even well-defined areas might change as a result of human activities, shifting hazard areas or creating new ones, such as when new built-up areas change flooding regimes or when developments move into woodlands, thereby increasing wildfire potential. Certain hazards are quite cataclysmic, such as the eruption of a volcano. Others may occur more gradually but also result in deleterious consequences, such as soil erosion.
THE LEGAL BASIS FOR ENVIRONMENTAL PLANNING
With the passage of the National Environmental Policy Act (NEPA) in late 1969, the U.S. Congress put into motion the machinery for protecting the environment.
NEPA required all federal agencies to “initiate and utilize ecological information in the planning and development of resource oriented projects.”
Furthermore, agencies were required to use “a systematic, interdisciplinary approach which will insure the integrated use of the natural and the social sciences and environmental design arts in planning and in decision making which may have an impact on [the human] environment.”
NEPA instructs all federal agencies to include an impact statement as part of future reports or recommendations on actions significantly affecting the quality of the human environment.
Several states and many other nations adopted similar environmental protection measures. So many environmentally oriented laws were enacted during the 1970s that it was dubbed the “environmental decade.” These laws sought to protect water quality and quantity, clean air, coastal zones, floodplains, wetlands, historical areas, rare and endangered animal and plant species, and prime agricultural lands. The laws originating from the 1970s to the present provide the basis for environmental planning in the United States and other nations.
In the United States, environmental planning laws rely on three general approaches: regulatory, financial incentives, and voluntary.
Regulatory approaches control activities that result in environmental degradation. For example, the amount of pollution that can be dumped by a factory into a water body can be regulated. If the factory managers fail to comply with regulatory limits or standards, they can be fined or forced to close operations.
Financial incentives can involve direct grants, such as providing funds to purchase lands for wildlife habitat conservation, or tax benefits, such as reductions in taxes for dedicating property for conservation.
Voluntary activities can be encouraged through environmental education designed to convince an individual to do the right thing, such as not to litter. Voluntary programs also involve nonprofit organizations engaged in conservation, cleanup, and protection activities.
Federal environmental laws significantly influence regional and community planning. For instance, the federal Clean Air Act requires the regional control of ozone, carbon monoxide, nitrogen dioxide, sulfur dioxide, lead, and particulate matter. These pollutants have serious health and welfare consequences. If an air quality control region fails to comply with federal air quality standards, then state and local transportation funding and plans can be affected. Federal flood control laws provide another example. Federal law requires local governments to adopt flood zones in order for buildings to qualify for federal flood insurance. Without such floodplain zoning, it becomes extremely difficult to build in a flood-prone area.
Environmental laws encompass many similar issues to air quality and flood protection that planners and urban designers need to address on a regular basis. This approach to environmental planning has a strong rule-making orientation. As planning educator Paul Niebanck (1993) noted, “Rules are everywhere and seem to cover everything: rules for disaggregating an issue; rules for selecting priorities; rules for measuring impacts; substantive rules; procedural rules; rules for discourse; rules for appeal; and so on.” Critics observe that this approach contains a strong reliance on analysis that might lead to “analysis paralysis.”
A contrary approach to environmental planning is based in place making. Whereas rule making has a strong legal and scientific orientation, place making has a stronger grounding in the environmental design arts. To achieve its maximum potential, environmental planning first needs rules to prevent harmful actions and to direct positive changes, and then creative interventions that result in healthier, more sustainable places.
A guiding principle for both rule making and place making is: first, do no harm. Understanding environmentally sensitive or critical areas is useful in preventing harmful actions. Environmentally sensitive areas can be defined as places vulnerable to negative environmental impact. These could include areas such as unstable soils, steep slopes, floodplains, wetlands, and vulnerable habitat. Areas can be defined as ecologically critical, perceptually and culturally critical, resource-production critical, and natural-hazard critical. On the local level, such an area may be used as a basis for a zoning district or an overlay zone that employs regulations specifically designed to protect that district.
SUSTAINABLE DEVELOPMENT
An emerging issue in environmental planning is sustainable development; that is,
development that meets the needs of the present without compromising the ability of future generations to meet their own needs. Advocates of sustainable development argue that environmental concerns need to be balanced with social equity and economics.
The intersection of these three Es—equity, economics, and environment—is suggested to be where the quality of human life can be best obtained. Some planners include a fourth E. In the case of Burlington, Vermont, it is education; for others, it is ethics.
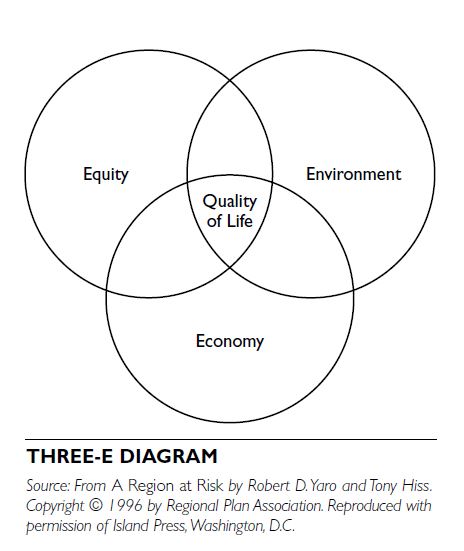
In urban design, it might be esthetics because of the visual relationship of built form to equity, environmental, and economic concerns. The concept that we should leave the planet a better place for subsequent generations provides one ethical argument for environmental planning. And there are other ethical and practical reasons:
We depend on the environment for our survival, so we better take good care of it.
We are not the only species on the planet, and we have a responsibility to protect the habitats of other creatures.
We can reduce costs and enhance benefits by using resources effectively and through environmental protection.
We will improve our health by ensuring that air, water, and soils are not polluted.
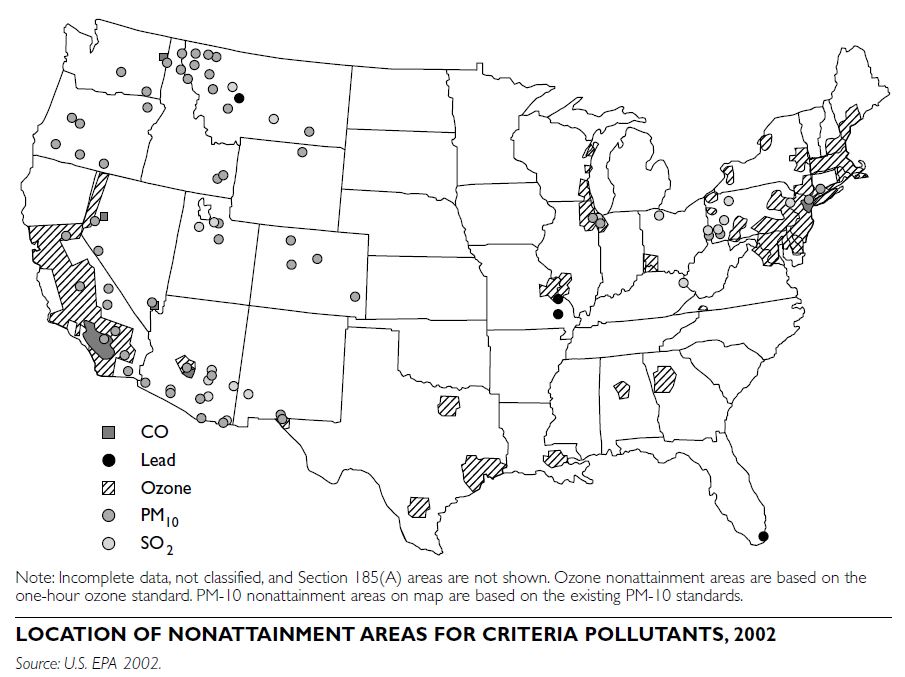
NATIONAL AMBIENT AIR QUALITY STANDARDS CRITERIA POLLUTANTS
Air quality in the United States is measured by whether a region is in compliance with the National Ambient Air Quality Standards (NAAQS) for the six criteria area pollutants initially designated in the Clear Air Act Amendments of 1970: carbon monoxide, lead, nitrogen oxides, particulate matter, ozone, and sulfur dioxide.
Carbon Monoxide
Poisonous to humans, carbon monoxide (CO) is a colorless, odorless gas. Approximately 90 percent of it in the atmosphere is a by-product of vehicle emissions from internal combustion engines. Fatal in large enough doses where ventilation is lacking, carbon monoxide reduces the ability of the body’s circulatory system to deliver oxygen. CO emissions increase when conditions are poor for combustion; thus, the highest CO levels tend to occur when the weather is very cold or at high elevations where there is less oxygen in the air to burn the fuel.
Lead
Lead (Pb) is a heavy metal. In the past, it came primarily from automotive emissions as an airborne pollutant, but since lead was phased out of U.S. fuels starting in 1973, atmospheric lead has been greatly reduced. Instead, stationary sources, such as lead smelters, peeling paint, and the production of storage batteries, have become the main sources. Lead poisoning of the bloodstream can result in development disabilities among children as well as cause cancer and neurological damage. In some urban areas, lead remains an issue due to remaining lead-based paint on older structures and past lead deposits in soils along highway corridors.
Nitrogen Oxides
Nitrogen oxides are a group of highly reactive gases that contain nitrogen and oxygen in varying amounts. Nitrogen dioxide (NO2), the most common, can often be seen as a reddish-brown layer over many urban areas. It is a main ingredient in smog. When combined with water vapor, it forms nitric acid, which as precipitation is known as acid rain. Nitrogen oxides form when oxygen and nitrogen in the air react with each other during combustion. Primary sources are motor vehicles, electric utilities, and other industrial, commercial, and residential sources that burn fuels.
Particulate Matter
Particulates are microscopic particles that comprise dust, soot, smoke, and other airborne debris. PM-10 refers to particulate matter no more than 10 micrometers in diameter. PM-2.5 is particulate matter less than 2.5 microns in diameter and is referred to as PM- fine. Sources for particulate matter include smokestacks, fireplaces, open fires, blown dust on dirt roads, various manufacturing plants, and almost all motor vehicles. Particulates produce haze, reducing visibility. Health threats include various respiratory ailments and nose and throat irritation. Particulates are a particular threat to those with existing respiratory ailments such as asthma.
Ozone
One of the most familiar criteria pollutants is ozone (O3). Ground-level ozone is also commonly known as smog. This is different from stratospheric-level ozone, also known as the ozone layer, which serves to protect the planet from ultraviolet radiation from the sun. At ground level, ozone is produced by a combination of pollutants. Sources include cars, smokestacks, and various volatile organic chemicals from paints, solvents, and other industrial materials. The process of smog formation is accelerated by certain weather factors, such as heat and temperature inversions (where warm air is trapped near the ground instead of rising).
Sulfur Dioxide
Like nitrogen dioxide, sulfur dioxide (SO2) is a component of acid precipitation when sulfur dioxide combines with airborne water vapor. The resulting mix can, over time, erode stone, metal, rubber, and plastic materials and structures. Sources include coal- fired electric generating plants, paper and metal factories, and gasoline-powered vehicles. Sulfur dioxide as a gas can also harm lungs and destroy plants by inhibiting photosynthesis.
AIR QUALITY STANDARDS
Criteria air pollutants are regulated based on health- based criteria (science-based guidelines), which are used as the basis for setting permissible levels. For each of these pollutants, the U.S. Environmental Protection Agency (U.S. EPA) has established primary standards to protect health and secondary standards to prevent environmental and property damage.
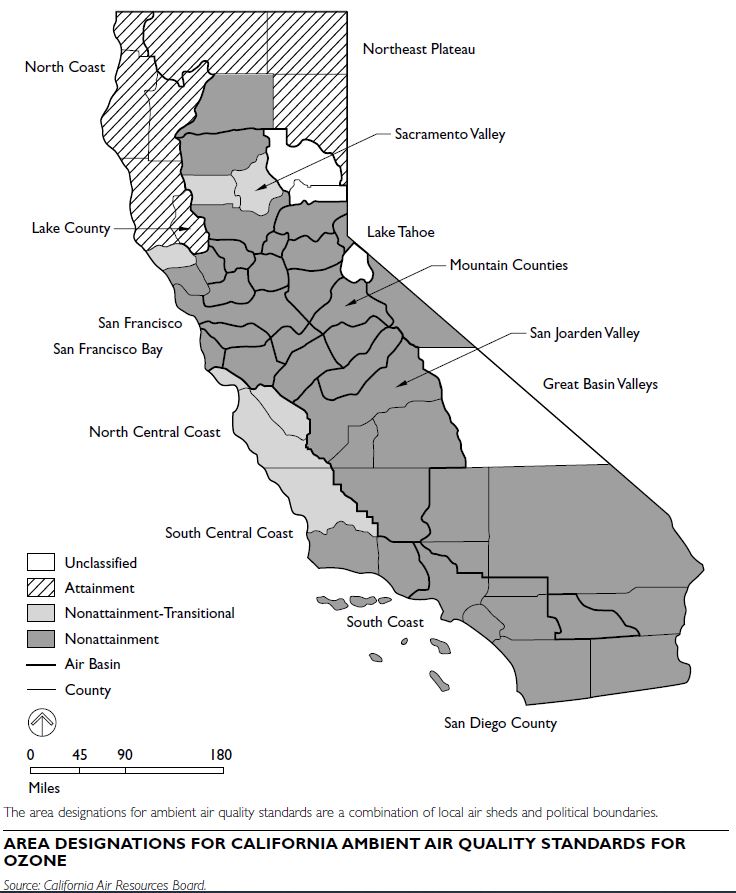
Attainment and Nonattainment Areas
An attainment area is a geographic area whose air has been determined through monitoring and modeling to have criteria pollutant levels below the primary standard. A nonattainment area is one whose air exceeds the primary standard for one or more criteria pollutants. In the Green Book, maintained by the U.S. EPA’s Office of Air and Radiation, Air Quality Planning and Standards Division, there are current data about areas of the United States that are in nonattainment for which criteria pollutants and the criteria behind current NAAQS standards. This publication also provides data on the areas of the country where air pollution levels persistently exceed the national ambient air quality standards. Of the six criteria pollutants, ozone has been particularly important to monitor because it is the main component of smog and contributes to lung damage and respiratory problems.
Air Quality Index
The Air Quality Index (AQI) also provides information on pollution concentrations for the six criteria pollutants.
State and local agencies use the AQI for reporting daily air quality to the public. The AQI may be found in national print and broadcast media. It also serves as a basis for community-based programs that encourage the public to take action to reduce air pollution on days when levels are projected to be of concern. AQI values for each of the pollutants are based on the concentration of that pollutant. The index is “normalized” across each pollutant so that, generally, an index value of 100 is set at the level of the short-term, health-based standard for that pollutant. The higher the index value, the greater the level of air pollution actions to address air quality.and health risk. The U.S. EPA has established six general AQI categories corresponding to different levels of health concern and index value ranges:
Good (0–50): Air quality is considered satisfactory. Air pollution poses little or no risk.
Moderate (51–100): Air quality is acceptable; however, for some pollutants, there may be a moderate health concern for a very small number of individuals. For example, people who are unusually sensitive to ozone may experience respiratory symptoms.
Unhealthy for Sensitive Groups (101–150): Certain groups of people may be particularly sen- sitive to the harmful effects of certain air pollutants, but the general public is not likely to be affected. For example, people with respiratory dis- ease are at greater risk from exposure to ozone, while people with respiratory disease or heart dis- ease are at greater risk from particulate matter.
Unhealthy (151–200): Everyone may begin to experience health effects. Members of sensitive groups may experience more serious health effects.
Very Unhealthy (201–300): Air quality in this range triggers a health alert, meaning everyone may experience more serious health effects.
Hazardous (over 300): Air quality in this range triggers health warnings of emergency conditions. The entire population is more likely to be affected.
TOXIC AIR POLLUTANTS
The 1990 Clean Air Act Amendments established a list of 189 toxic air pollutants for which the U.S. EPA must establish categories of sources for their release, such as auto body shops or coal-burning electric generation plants. The difference between these 189 toxic air pollutants and criteria pollutants is that the latter were targeted because they are the most common pollutants, while many of the toxic air pollutants are specific to certain industrial processes, such as various types of chemical plants, and thus are not common. They may still pose important public health issues, in particular local areas affected by sources emitting such hazardous air pollutants.
Mobile Sources
Motor vehicles, engines, and equipment that moves or that can be moved from place to place, including cars, trucks, buses, earth-moving equipment, lawn and gar- den power tools, ships, railroad locomotives, and airplanes, are considered mobile sources of air pollution.
Stationary Sources
Stationary sources include any place or object from which pollutants are released that does not move around. Stationary sources can be further defined as point, biogenic, and area sources. Point sources include factories and electric power plants; biogenic sources include trees and vegetation, gas seeps, and microbial activity; area sources consist of smaller stationary sources, such as dry cleaners and degreasing operations.
Planning decisions routinely affect air quality in metropolitan areas. Traffic patterns resulting from the routing of highways and the development of transit systems that help to relieve congestion affect air quality by influencing the level of vehicle emissions. Decisions about the location and permitting of various stationary sources, such as industrial plants, also affect air quality. Increasing vegetative and forest cover through land-use regulations, incentives, and other means may help to mitigate regional air pollution problems. More broadly, urban form dictates the shape of many transportation and other decisions that can affect air quality. The Washington State Department of Ecology has identified five characteristics of urban form that help reduce driving distances, increase use of alternative modes of transportation, and, as a result, positively influence air quality:
Metropolitan Planning Organizations Metropolitan planning organizations (MPOs) are responsible for planning transportation projects meant to maintain their region’s air quality or move toward attainment of federal air quality standards over time. There are 341 MPOs, and each has to develop a transportation plan containing three elements:
Regional Transportation Plan (RTP): RTPs have a
20-year planning horizon, and must be consistent with the state transportation plan and the state air quality improvement plan.
Transportation Improvement Plan (TIP):
TIPs, which are updated at varying intervals, depending upon state requirements (typically between two to three years), and for varying planning horizons (typically six to seven years), must also be consistent with the state transportation plan and air quality plan. These plans include specific techniques and implementation
Individual Transportation Projects: Individual transportation projects include specific projects to be undertaken, such as roads, rail lines, and bus routes. To be considered for federal funding, these projects must be consistent with the state transportation plan, TIP, and air quality improvement plan. They also have to be listed in both the RTP and TIP.
The U.S. EPA also requires states to submit State Implementation Plans (SIPs).
These plans describe a state’s strategy for achieving and maintaining the National Ambient Air Quality Standards. States with areas that do not meet the standards are required by the Clean Air Act to develop a written SIP outlining the steps they will take to reduce air pollution.
The purpose of a SIPis to ensure the implementation of programs that will reduce emissions. State environmental agencies prepare and submit a pro- posed SIP to the U.S. EPA that describes their plan, outlines air pollution reduction programs, contains projections of emission reductions from these pro- grams, and commits to implement and enforce these programs. The SIP must also explain how funding and resources will be provided, and it must provide supporting technical information.
TOXICS RELEASE INVENTORY
An urban area’s industrial base has potential impacts on local air quality. The Toxics Release Inventory (TRI) is a publicly available U.S. EPA database con- taining information on toxic chemical releases and other waste management activities reported annually by certain industry groups and federal facilities. This information is also available at the state and local levels.
An air shed is a specified volume of air with similarities in climate, weather, and topography. Typically, it also shares issues of development, planning, or problems of air quality related to emissions, meteorology, and terrain. Air sheds are dynamic in geographic extent and volume; the volume of air that constitutes an air shed for any given period greatly depends on emissions, local/regional meteorology, and accepted regulations of health related to pollutants of concern to the community located within the air shed.
An air basin is often defined as a large land area containing one or more individually distinctive air sheds that generally has within it similar meteorological and geographical conditions. To the extent possible, an air basin is also defined along political boundary lines, including both the source and receptor areas of pollutants. For example, California is divided into 15 air basins, which contain many smaller individual air sheds. In many ways, an air shed is similar to a watershed. It contains a “fluid,” which in this case is the atmosphere; its geographical extent may be confined to a specific area; it may contain air contaminants concentrated more frequently in lower elevations due to inversions and air drainage; and, without major external weather effects from outside the air shed, it may be well identified through the analysis of digital terrain mapping, vertical profiling of the atmosphere, and local emission inventories.
However, unlike water, air can move upvalley or upslope in the terrain and spill into another nearby topographic basin. As a result, air shed dimensions and boundaries may be highly variable geographically and over time of day, year, and from year to year.
CONDITIONS WITHIN AN AIR SHED
The vertical mixing potential of air over a day varies considerably. As the sun heats the Earth’s surface and causes air to rise over an increasing volume of air above the surface, the volume of air carrying pollutants expands accordingly. This expanded volume may cause the pollutants to be diffused over a larger zone than may occur at night when the Earth cools, the lower atmosphere contracts, inversions set in, and more local diffusion or confinement of pollutants occurs over a smaller zone both vertically and horizontally. Thus, the air shed relative to a particular pollutant may expand and contract even within a day’s time.
Movement of air within an air shed is often characterized from weather stations with the aid of wind “roses,” which describe the frequency of wind direction at any location for any time of day or year and the speeds associated with those directions.
Air shed analysts keep close tabs on the vertical mixing potential by using air-sampling devices to measure the vertical dimension of the atmosphere, which includes factors such as temperature, wind velocity, wind speed, humidity, and pressure. Models and monitoring systems are used to predict diffusion and concentration, and to monitor air quality.
SCALE OF AN AIR SHED
The penultimate air shed is the entire three-dimensional spherical shell of air surrounding the Earth. It is essential to analyze this dimension to facilitate the understanding and mitigation of gases, such as carbon dioxide (CO2), major continental emissions of sulfur dioxide (SO2), diffusion into the upper atmosphere of chlorofluorocarbons (CFCs) that affect global ozone (O3), and massive emissions of particulates from continents to oceans or to other continents from dust emissions and industrialization processes. These global-to-regional interconnections must be kept in mind when addressing certain environmental problems, such as how long-range transport of pollutants might explain local pollutant events. Modeling of global and regional atmospheric processes over geographical areas larger than the immediate con- fines of any particular air shed may be required. These scales and levels of air sheds/air basins are common across countries, hence protocols for modeling these processes, such as the Kyoto Protocol, have to be developed at high governmental levels.
PLANNING AND AIR SHEDS
When considering a particular air shed, planners, air quality analysts, and policy makers, among others, often face many methodological, scientific, and managerial issues, which typically require the formation of local alliances or stakeholder affiliations in order to fully comprehend them. For example, Our Airshed is a partnership covering approximately 2,700 square miles (4,500 square kilometers), including various communities and a park, near Edmonton, Alberta. Such alliances assist in developing management plans, focusing on problems, and ultimately identifying possible air quality and sustainability solutions.
From the planning perspective, considerations often range from producing fast-track fixes to preventing deleterious possibilities of air quality in a proactive way so as to carefully address the future quality of life and health of the populace. The focus must become the “nonattainment” area, other critical parts of the area, or the whole air shed. Environmentally related management plans for communities and regions are multifaceted, often comprising many issues that have to be considered together to produce solutions, such as factors related to biological, land resource, recreation, water, and, certainly, air resources. Each of these areas is challenging, and conflicts often arise among planners in attempting to find solutions.
In addressing air issues, each area plan should attempt to identify those of local and regional concern that affect health, while considering, to as great a degree as possible, the larger regional issues, such as greenhouse gas impacts on the local region and long-range transport of pollutants that affect the local area. These plans must also develop an appreciation for future development scenarios in the region and account for them in the plan.
Dark roofs and paving materials absorb more of the sun’s rays than vegetation, causing both surface temperature and overall ambient air temperature in urban areas to rise. This phenomenon is called the urban heat island effect. Trees and other vegetation naturally process solar radiation and help reduce ambient air temperatures through evapotranspiration—when water absorbed by vegetation evaporates from leaves and surrounding soil, naturally cooling the surrounding air. When vegetation is removed and replaced by urban development, temperatures can increase noticeably. Areas of the United States with a hot, arid microclimate, such as Phoenix, Arizona, are particularly affected adversely by the heat island effect. Annual temperatures, rainfall, and wind regimes all are factors in urban heat island formation.
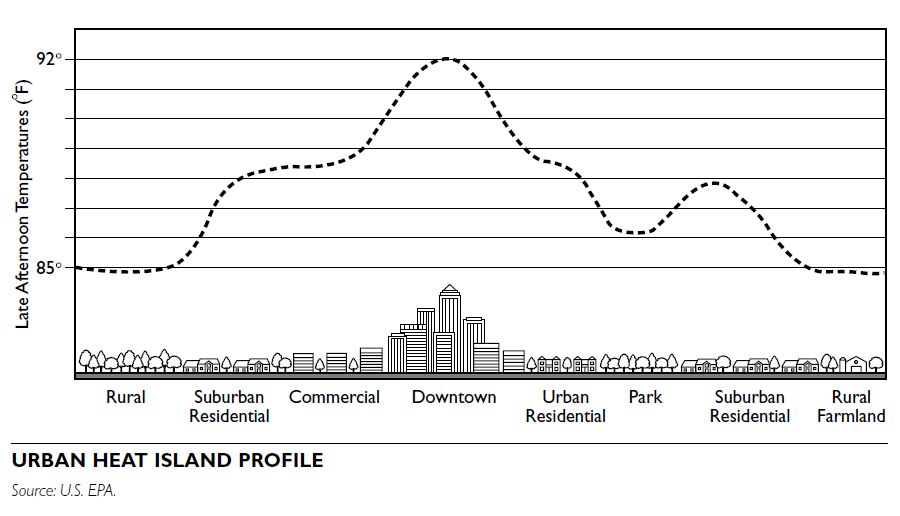
REASONS HEAT ISLAND OCCUR
Most urban building materials are watertight, so moisture is not readily available to dissipate the sun’s heat through evaporation. Temperatures of unshaded, impermeable surfaces can reach up to 190°F (88°C) during the day, while vegetated surfaces with moist soil might reach only 70°F (18°C). Also, urban areas trap more of the sun’s energy due to the use of dark materials and the canyonlike configurations of buildings and pavement. Anthropogenic (human-produced) heat, slower wind speeds, and air pollution in urban areas can also contribute to heat island formation.
The increased surface temperatures in the urban environment lead to increased air temperatures, especially at night, as urban surfaces cool slowly and warm the air around them. The warming effects of the heat island are most pronounced during calm, clear weather conditions, and are most conspicuous during summer and winter. In most communities, the negative effects of the summer heat island include increased discomfort, a rise in the incidence of human health problems, higher energy bills, and stress on vegetation. In contrast, in colder areas at higher latitudes and elevations, the winter warming effects of the heat island can be somewhat beneficial.
HEALTH AND COST IMPLICATIONS
Research by the Lawrence Berkeley National Laboratory (LBNL) in Berkeley, California, indicates that on summer days in Los Angeles, a one-degree Fahrenheit temperature increase boosts the risk of smog formation by 3 percent. Smog, or ground-level ozone (as opposed to the atmospheric ozone that protects the Earth from ultra- violet radiation) is an invisible pollutant that can permanently damage lungs. Chronic bronchitis, asthma, and other cardiopulmonary disorders may be caused or exacerbated by ground-level ozone.
There are also noticeable cost implications. The same one-degree increase in Los Angeles is estimated to increase the demand for cooling power by 2 percent, which translates to about $25 million worth of electricity every year over the entire city. In addition, metropolitan areas can lose federal transportation dollars if their states do not provide the U.S. Environmental Protection Agency (U.S. EPA) with an acceptable State Implementation Plan (SIP) to ensure compliance with U.S. EPA air quality standards for ozone.
LAND COVER ANALYSIS
To develop a heat island mitigation strategy, it is important to understand the relationship between land cover types and the formation of urban heat islands. Remote sensing data from satellites and air- craft can provide infrared images from which surface temperatures can be derived and associated with land cover and land-use classes. In infrared images, warmer areas appear bright or white, and cooler areas appear dark, from gray to black. Brighter areas are often roofs and paved surfaces. Darker areas are primarily vegetation and highly reflective light roofs. Infrared satellite data at approximately 100-foot (30-meter) and coarser resolutions are available for all areas of the United States. By using these data, urban areas can be analyzed for hot spots in terms of their land cover or whatever elements exist on the land (e.g., forest, grass, concrete, asphalt, buildings and water). The spatial and temporal resolution of the imagery will influence the depth of possible analysis.
Based on a preliminary analysis of major land cover types in four cities—Atlanta, Georgia; Baton Rouge, Louisiana; Salt Lake City, Utah; and Sacramento, California—that were part of the joint NASA and U.S. EPA Urban Heat Island Pilot Project, conducted in 1998, surface temperatures by land cover type may be generalized from hottest to cold est, as follows:
Planners, urban designers, urban foresters, and others can use remotely sensed data to identify hot spot areas and then develop appropriate urban heat island mitigation strategies.
MITIGATION STRATEGIES
Successful urban heat island mitigation strategies require community participation and acceptance. The identification of stakeholders and partners as early as possible will facilitate development and implementation of strategies.
As the connection between higher temperatures in urban areas and poor air quality continues to be realized, strategies such as using more reflective building materials and tree planting designs to reduce surface temperatures are becoming more popular. Continuing research indicates such strategies can improve air quality, promote energy savings, and produce the added benefit of increasing the livability of urban environments. Local climate has a significant connection to the overall benefits that can be expected from urban heat island mitigation strategies. For example, areas with cooler mean temperatures and more cloudy days, as in the Pacific Northwest, would likely have less energy savings compared to the southwestern United States with its reduced cloud cover and rain and higher summertime temperatures. Also, the effect of sea breezes in dispersing pollutants may affect potential air quality benefits. Finally, trade-offs between roofing types and insulation may also be influenced by the local climate.
Reflective Roofs
When the sun shines on buildings with dark-colored roofs, most of the heat absorbed by the roof is transferred inside, which causes a number of adverse impacts: the demand for air conditioning increases; energy usage and costs are higher; and the roof mate- rials deteriorate more rapidly. More than 90 percent of the roofs in the United States reach summer peak temperatures of 150°F (66° C) to 190°F (88° C). Materials commonly used in commercial property roofing include ethylene propylene diene monomer (EPDM), a type of rubber, and asphalt and tar with a gravel base.
Roofs with these materials have been found to be hot spots of surface heating in all four cities studied in the Urban Heat Island Pilot Project. By putting a lighter-colored material on the roof, such as river rock, the roof becomes cooler, primarily because it is more reflective. The insulating capability depends upon the thermal conductivity of the rock material; that is, the amount of energy absorbed by the rock that is then conducted to the roof.
Depending on the slope of a building’s roof, two categories of roofing materials are available for use. Low-sloped roofs, with slopes of 2:12 or less (less than 2 inches of rise over 12 inches of run), are most commonly found on commercial and industrial build- ings and can be covered with cool roof coatings or single-ply materials. Many cool, low-slope products are available, primarily white; however, manufacturers are working toward providing highly reflective, colored products for low-slope roofs.
Sloped roofs with more than 2 inches of rise per 12 inches of run are found mostly on houses and small commercial buildings. They are generally covered with clay or concrete tiles, metal roofing, shingles, or shakes. Cool roof products available for sloped roofs are much more limited, which includes the majority of the residential market, where aesthetic considerations become more important as well. The U.S. EPA’s Energy Star Program and the Cool Roof Rating Council are two sources of additional information on cool roofing products.
Green Roofs
Cooler roofs can also be achieved by innovative rooftop design, which can also provide aesthetically pleasing and functional places. One design alternative is the so-called green roof, a combination of vegetation, hydrology, and architecture. Originally conceived in Iceland, where sod roofs and walls have been used for centuries, modern green roof technology was developed more than 30 years ago in Germany, and today it is a popular approach throughout Europe. Such roofs consist of several layers of protective materials, including a waterproof membrane at the base, a root barrier, an optional insulation layer, drainage layers, a filter fabric for fine soils, the growing medium, and the plant material. These systems are not designed for the weight of people or trees. However, they can be installed on roofs with slopes up to 33 percent.
Rooftop Gardens
In contrast to green roofs, rooftop gardens are more elaborately designed landscapes intended for human interaction and are engineered to conform to heavier load requirements. The City of Chicago, for example, has installed a rooftop garden on top of City Hall. The city also has plans to install gardens on other city ward buildings and buildings along elevated public transit routes.
Trees and Shading
Planting trees to shield buildings from the sun’s rays can reduce the amount of heat buildings absorb. Within 10 to 15 years—the time it takes a tree to grow to a significant size—strategically placed trees can reduce heating and cooling costs for a typical home or office by an average of 10 to 20 percent. Trees and vegetation are most useful when planted in strategic locations around buildings. Researchers have found that planting deciduous species to the west and east is typically most effective for cooling buildings, especially if these trees shade windows and part of the building’s roof. Planting deciduous trees to the south may reap the benefits of solar energy in the winter, when the sun is low in the sky, because these trees shed their leaves in winter, allowing sunlight and warmth through. Conversely, planting evergreen species to the north is one approach to impede winter winds (Nowak and Dwyer 2000).
Shading pavements in parking lots and streets is also an effective way to cool and beautify urban areas. Trees can be planted around the perimeters or in medians inside parking lots or along streets. Some communities have enacted ordinances requiring street and parking lot planting. Generally, increased shading will make urban areas more comfortable and healthy for people.
Additional benefits from trees include reductions in stormwater runoff, erosion, and urban noise.
Paving Materials
Roads, parking lots, and driveways paved with dark impervious materials contribute to the urban heat island effect. Most paved surfaces in an urban area are asphalt or concrete. While dark new asphalt has a lower reflectivity and higher surface temperature than new concrete, as both surfaces age, the differences in reflectivity become significantly smaller. Additives can also be used with either surface to increase reflectivity and give planners a range of potential heat island mitigation options.
One technique, Ultra-Thin Whitetopping, can be used on roads and parking lots to reduce maintenance costs and cool surfaces. This process removes the outer several inches of deteriorated asphalt and tops the remaining asphalt with a concrete mold 2 to 4 inches thick. Key design elements include adequate pavement thickness, concrete strength, drainage, and jointing.
Porous pavement, an alternative for parking areas, tennis courts, pool decks, greenhouse floors, and patios, both reduces runoff and cools surfaces. It allows airflow and moisture to penetrate the paved surface, producing a cooler surface than impervious paving materials. Porous pavements can consist of concrete, asphalt, open-celled stones, and gravel mixed to create an open-cell structure allowing for the passage of air and water. Water is allowed to filter through the concrete layer and recharge groundwater sources, thereby reducing runoff volume and velocity.
Development Patterns
A study by Stone and Rodgers (2001) focused on the relationship between residential development pat- terns and urban heat island formation in the Atlanta, Georgia, area. While acknowledging that further work must be done to establish the significance between urban design decisions and heat island formation in different climactic areas, the authors found for the Atlanta area that lower-density housing pat- terns contribute more radiant heat to surface heat island formation than higher-density development. The amount of land dedicated to residential lawns and landscape planting in areas of one-half- to three- acre lots emitted higher net thermal emissions than areas with one-eighth- to one-half-acre lots. Compact moderate to high-density new construction, along with area-based tree ordinances, are recommended as policy strategies to mitigate the effects of development on regional climate change.
The hydrologic cycle describes the movement of water about the Earth. Its components include precipitation, evapotranspiration, surface runoff, recharge, groundwater flow, and discharge back into lakes and oceans.
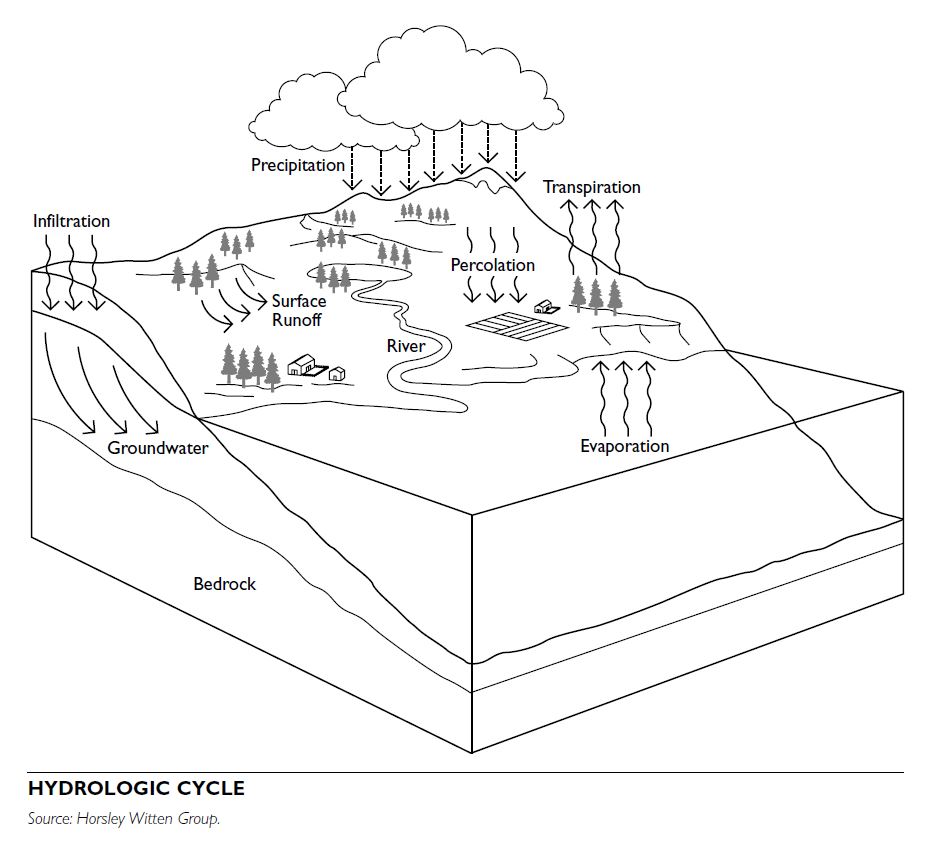
Precipitation
Precipitation includes rainfall, snowfall, and hail. The annual amounts, temporal distribution, and intensity of precipitation vary geographically. A significant portion of annual precipitation returns to the atmosphere through evaporation and transpiration.
Evapotranspiration]
Evaporation occurs on land and water surfaces. Transpiration, from plants, also returns water to the atmosphere. Together these phenomena are called evapotranspiration. Evapotranspiration may recycle as much as 50 percent of precipitation back to the atmosphere and—more in arid environments. The water not recycled, the net precipitation, replenishes streams, lakes, wetlands, groundwater supplies, and, ultimately, the ocean.
Surface Runoff
Surface runoff is precipitation that runs off the land’s surface and flows downhill. Precipitation, soil type, slope, and vegetation all influence the amount of surface runoff. Areas with low-permeability soils, steep slopes, and sparse vegetation may have more than 90 percent of net precipitation flow as surface runoff.
Recharge
Recharge refers to water that infiltrates the lands’ surface and percolates downward to the underlying water table, the upper surface of groundwater. Areas with high-permeability soils, minimal slope, and sparse vegetation have the highest recharge rates.
Groundwater
Groundwater is water present in saturated ground, where all the pore spaces are completely filled with water. Groundwater moves slowly, commonly less than one foot per day, and moves down-gradient from higher to lower water table elevations. Ultimately, groundwater discharges to streams, lakes, wetlands, or the ocean. This discharge is called base flow, and it is important to many ecosystems.
POTENTIAL IMPACT FROM DEVELOPMENT
Planners and urban designers must incorporate their knowledge of the hydrologic cycle into their work to protect the wide range of water resources that depend upon the cycle. Land development commonly disrupts the hydrologic cycle and can result in significant environmental damage.
Impervious Surfaces
Impervious surfaces, such as parking lots, roads, and rooftops, preclude the infiltration of precipitation into soils and can significantly reduce groundwater recharge, subsequently lowering the water table, depleting groundwater supplies, and reducing ecologically important base flow to streams and wetlands. Some commercial land uses, such as shopping malls, can render 90 percent or more of the lands’ surface impervious through structures and paving for parking, causing a notable reduction in recharge rates.
Impervious surfaces increase surface runoff rates, sometimes causing flooding to down-gradient properties and inhabitants. Flood control structures, such as detention basins, attempt to mitigate this problem by slowing the flow of surface runoff. These structures do not commonly restore natural recharge rates, however. Better methods to manage stormwater include constructed wetlands and infiltration basins, which replenish the underlying groundwater system.
Water Extraction
Water extraction from both groundwater and surface water supplies also can disrupt the hydrologic cycle,causing environmental impacts. For example, pump- ing a water supply or irrigation well will cause both short-term and long-term declines in the water table. Unless the water is returned back to the groundwater system, long-term negative effects, including wetland losses, diminished stream flows, and depleted aquifers, will result.
MANAGEMENT TECHNIQUES
Guidelines have been developed to minimize and, in some cases, eliminate impacts to the hydrologic cycle. Flood control is the most common technique applied to land-use plans and development. Many local regulations require that postdevelopment peak flow of surface runoff be managed so that it will not exceed predevelopment peak flow runoff rates. This reduces the potential of negative effects of flooding to downstream properties. The 10-, 25-, and 100- year storm events are commonly used as benchmarks for this. Peak flows are typically managed using detention basins, which temporarily store the stormwater and slowly release it following the storm event.
A less commonly applied technique is to require that predevelopment or natural recharge rates be maintained in postdevelopment. This technique maintains groundwater reserves and base flows to downgrade streams, ponds, and wetlands. Recharge is accomplished through minimizing impervious surfaces and stormwater infiltration. Pretreatment of stormwater should be required prior to infiltration to protect water quality.
Integrated Water Management
Integrated water management is an evolving approach for integrating three infrastructure elements that historically have been addressed through independent planning processes: wastewater, stormwater, and water supply. Wastewater projects have traditionally focused on collecting wastewater in sewers, treating it, and disposing of it. This results in a hydrologic shift, where water is transferred to another watershed basin. This can result in a loss of water in aquifers and watersheds. Integrated water management seeks to balance the hydrologic cycle before returning the traded wastewater to the on-site basin, thereby replenishing water supplies. In this way, wastewater management can also be used to manage and maintain water supplies.
Innovative stormwater programs replenish water supply by collecting surface runoff, treating it, and infiltrating it back into aquifers. In some cases, stormwater infiltration systems can be designed to enhance natural recharge rates to compensate for other consumption losses in the aquifer or basin.
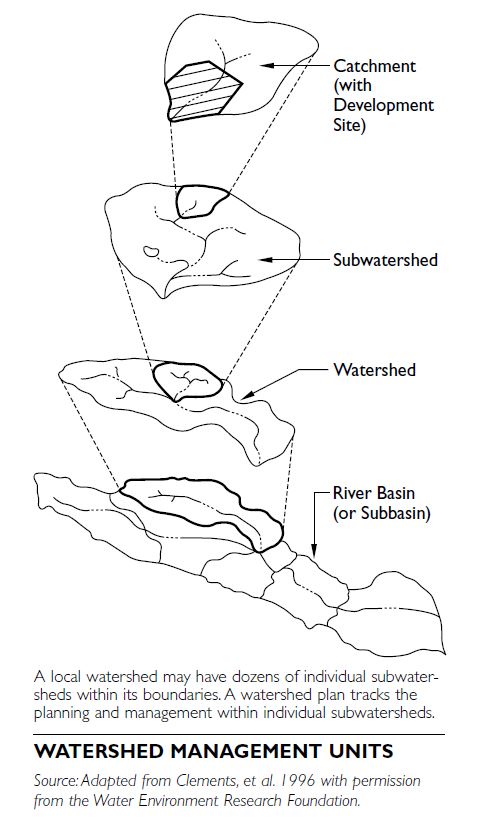
A watershed is the land area that contributes surface water to given location. A watershed is defined and delineated by surface topography. Water that falls on one side of a given ridge ultimately drains to a given location; this process defines the watershed boundary.
Although no standard watershed size exists, watershed management programs are often designed and implemented in direct response to the size of a water- shed. Regulatory agencies, environmental organizations, and planners increasingly are evaluating and integrating water resources planning at the “watershed scale.”
WATERSHED SCALE TERMS
Defining what constitutes the watershed scale depends upon various factors, such as geographic location and overall planning objectives. Five common terms are used to help planners describe watershed scale and adjust management programs accordingly. (Note: These terms are all based upon U.S. practice; watersheds may be defined by a different set of terms in different countries.)
Basin. A basin typically defines a major river, estuary, or lake drainage area that covers several thousand square miles. It may cover major portions of a state or group of states.
Subbasin. A subbasin is smaller in area than a basin, ranging from several hundred square miles in area. Watershed. A subbasin is composed of a set of even smaller watersheds, usually in the range of tens to a few hundred square miles.
Subwatersheds. A watershed is composed of subwatersheds typically ranging in size from a few to several square miles. They are often defined as the land area above the confluence of two second-order streams.
Catchment area. Subwatersheds are composed of a group of catchment areas. They are usually measured in acres and can be defined as the land area above a given point that drains to the first intersection of a stream.
WATERSHED CHARACTERIZATION
Watershed planning involves a characterization of baseline conditions to establish the foundation of the plan development.
Impervious Cover Characterization
Urbanization has a measurable and quantifiable impact on surface water hydrology, morphology, quality, and ecology (Horner et al. 1996). This impact can be used to help develop watershed protection and restoration plans. A simple model that depicts current and future water resource quality as a function of increasing impervious cover can predict the relationship between impervious cover and watershed quality.
Impervious cover evaluation is typically used to help define the intensity of land uses and provide an overall estimate of water resource health. Three broad classifications—low, moderate, and high—can be used to assess the potential for watershed restoration and provide a baseline for watershed protection. At relatively low levels of impervious cover, receiving water characteristics are typically of the highest quality and support the most sensitive aquatic species, with the presence of abundant species indicating diversity. Watershed plans should strive to protect these conditions. At moderate levels of impervious cover, receiving water characteristics begin to exhibit measurable and quantifiable degradation, but still maintain some of the beneficial uses. At relatively high levels of development, where impervious cover begins to exceed approximately a quarter of the watershed, receiving water characteristics show few beneficial uses and exhibit many of the effects of water runoff from impervious surfaces, including increased flooding, extremely poor water quality, highly altered morphology, and little aquatic habitat. Although the impervious cover model is a powerful tool, there are assumptions and limitations that must be clearly understood. Prior human activities may have caused severe, long-term impacts on streams with relative low levels of impervious cover. Unusual geologic conditions may allow some streams to maintain unique aquatic diversity, even with mod- est impervious cover. The impacts of impervious cover are generally most noticeable on small streams and rivers. As watersheds grow in size to the subbasin level, the effects of other land uses, pollution sources and disturbances, and unique geologic settings may dominate the quality and dynamics of these systems.
Alternative Receiving Waters
Receiving waters include rivers, streams, lakes, oceans, reservoirs, aquifers, or other watercourses that receive water input. The type of receiving water to which a watershed drains dictates many aspects of a watershed plan. For streams, channel morphology, water quality, riparian cover, and temperature are generally the variables most notable in the watershed planning process. For freshwater lakes and reservoirs, phosphorus loading, sediment inputs, bacterial loading, and shoreline erosion dominate the variables list. In coastal systems, nitrogen, pathogens, and viruses are key parameters to assess and manage. Finally, where groundwater aquifer protection is a concern, recharge rates, soluble pollutants, pathogen inputs, and the connection between surface activities and groundwater, particularly where groundwater is the primary source for potable drinking water supplies, are all important factors.
WATERSHED MAPPING AND MODELING METHODS
Many complex tools exist to allow planners to develop watershed maps. These include the latest GIS technologies, many of which are available online. The key is to know how to integrate data, models, and mapping with watershed plan objectives.
Skill and experience are valuable in integrating data accuracy, ease of adaptation, and data collection time with key variables needed for watershed planning and protection. For example, if a municipality does not maintain updated maps of the storm drainage net- work, the planner must evaluate the cost of securing that information, including the cost of data manipulation and conversion, with the need to know where storm drainage outfalls exist and which land uses drain to which locations. In most watershed plan scenarios, storm drainpipe locations are vital to developing an effective plan, so the planner must weigh the techniques and costs of accurate, somewhat accurate, or general information. General accuracy levels include:
Models are valuable watershed planning tools. A model has been developed for almost every situation. The keys to a model’s success are the resources, skills, budget, and audience of the watershed plan. Sometimes complex models are warranted, particularly to defend a regulation that might be subject to legal challenges. The complexity of the model depends on the situation. The most important rules of modeling are verification of results, usually through the collection of monitoring data, and calibration of variables where predictive results are needed. One resource for evaluating the different models typically used in watershed planning is in Shoemaker (1997).
WATERSHED MANAGEMENT STRATEGIES
Watershed planning and management applies an integrated approach that involves people with a wide range of skills, interests, backgrounds, and experience from a broad cross section of professions. The most successful watershed management programs are implemented with both public and private involvement. Many view the watershed approach as the most comprehensive way to solve complex problems that affect receiving water resources.
An extremely wide array of watershed management strategies and techniques have been employed in watershed planning activities across the country. A detailed examination of these techniques is beyond the scope of this text, but planners and watershed managers should know these techniques exist and that adaptations have been applied in the broad spectrum of watershed planning in both protection and restoration plans and in the vast array of receiving waters.
Watershed plans are often developed as either protective plans, to maintain the current qualities of a watershed, or as restorative plans that planners need to implement to correct past abuses and to attain an improvement in water resource quality. In many cases, and particularly in coastal areas, watershed plans must tackle both protection of existing resources and restoration. Watershed Protection
The Center for Watershed Protection, a national non- profit watershed research organization, has advanced eight tools for use in the watershed protection arena (Center for Watershed Protection 1998). This broad classification system identifies eight major management areas that roughly correspond to the stages of the development cycle, from land-use planning and zoning and site design to construction and ownership.
Watershed Restoration
Watershed restoration involves adapting watershed protection tools to address the often unique situation in restoration areas. Many of the watershed protection tools will serve as restoration tools with specific modifications, most notably the last four listed above. Four prominent restoration strategies are listed here: Environmental site assessments and remediation. Many existing sites have prior contamination of soils and groundwater. This tool describes the approaches and methods to identify both natural systems and synthetic contamination remediation methods.
Preservation of natural area remnants. Unlike new development areas, restoration watersheds often have only fragmented remnants of natural systems. Planners must balance preservation or restoration with other competing uses, such as infill and redevelopment near existing infrastructure and transit, which are often linked to smart growth initiatives.
Restoration of impaired aquatic systems. Such restoration encompasses the broad spectrum of management techniques in the stream restoration arena, including habitat restoration, natural stream geomorphic design, stream day- lighting, aquatic corridor replanting and revitalization, and wetlands restoration. Reuse and adaptation of existing buildings and infrastructure. Reuse and adaptation are key components of watershed restoration, where existing buildings, parking lots, and other infrastructure are reused, improved, and updated to provide a net improvement beyond existing conditions.
Rivers and streams arise in the landscape because the atmosphere brings water evaporated from the oceans over the land, with the result that more rain and snow fall on the continents than evaporates from them. Rivers and streams carry from land to sea excess water, sediments, nutrients, and organic material. Along their course, they support diverse habitats, adjacent riparian forests, and floodplains. Surface flow in streams also interacts strongly with ground- water in the subsurface.
Where the water table slopes from the adjacent land toward the stream, groundwater flows into the stream, creating a gaining stream. By contrast, along a losing stream, water flows from the stream into the groundwater, often maintaining bands of riparian vegetation in semiarid areas. The hyporheic zone comprises the shallow groundwater below and adjacent to the channel with frequent interchange with the surface water. It supports a variety of organisms. The land area draining to a particular river is its drainage basin, also termed the catchment or water- shed of the river.
FLOW MEASUREMENT
Flow is the volume per unit time of water passing a point.
U.S. Measurement Units
In the United States, stream flow is usually expressed in cubic feet per second (cfs). Flow from wells is usually expressed as gallons per minute.Annual flow or runoff is sometimes reported in mil- lions of gallons, more commonly in acre-feet. An acre foot is the volume of water covering 1 acre to a depth of 1 foot, which is equal to 43,560 cubic feet or approximately 326,000 gallons. Flow records for many rivers and streams in the United States can be accessed on the U.S. Geological Survey website (Kondolf and Piégay 2003).
International Measurement Units
Outside of the United States, the majority of other countries report flow in liters per second or cubic meters per second. Annual flow is expressed as thou- sands or millions of cubic meters per year.
Hydrographs
The plot of daily flows over a year is the annual hydrograph. The seasonal patterns shown in hydro- graphs can vary widely, reflecting differences in geology and climate among watersheds. Both the base flow during dry months and high flows are important, the former mostly for water supply and maintaining ecological values, the latter for analyzing flood risk.
THE EFFECTS OF URBANIZATION ON BASE FLOW AND FLOOD FLOW
Flood flows and base flows are both affected by urbanization. Because pavement prevents rain from infiltrating into the soil, more rain runs off during storms. For the same rainfall, peak flows in urban areas may increase 5 times over predam conditions.
Base flows can be affected in different ways: less infiltration means less recharge of the water table, and thus less groundwater seeping into the stream to maintain flow during the dry season, so streams may dry up during summer and fall in urban areas. However, some streams that naturally dried up during the dry months now run year-round. These streams are fed by “urban slobber,” which is water that comes from sources such as excess landscape irrigation and leaking pipes. It may be of poor quality due to high concentrations of nutrients and other constituents.
SEDIMENT LOADS
Streams and rivers also carry sediment, thereby shaping the landscape, eroding highlands, and depositing valley bottoms and deltas. The sediment load of a river consists of the bed load, which is sand and gravel transported along the bed; the suspended load, which is the clay, silt, and sand held aloft in the water column by turbulence; and the dissolved load, which comprises the soluble constituents.
CHANNEL TYPES AND RUNOFF RATES It is important to distinguish between river channels that flow through bedrock and those whose bed and Channel banks are composed of river-borne sediments or alluvium. Bedrock channels are relatively resistant to change because the bedrock resists erosion. Alluvial channels can self-adjust to the flow regime and sediment load supplied to them from the drainage basin. If the independent variables of runoff and sediment load change, the shape and dimensions of an alluvial channel will usually change in response.
Human activities, such as clearing for agriculture or urbanization, commonly increase runoff rates, leading to larger floods, which in turn may cause alluvial channels to erode and widen. Increased sediment loads from activities, such as land clearing, timber har- vesting, or road building, can increase sediment loads, leading to deposition of fine sediment in gravels, which affects aquatic habitat. A larger buildup of sediment in the channel can induce channel instability. Dams trap sediment, so the areas downstream may be sediment-starved, often causing erosion of the stream bed, lowering its elevation. This is called channel downcutting, and loss of aquatic habitat. Gravel and sand are mined from many rivers, causing sediment deficit and also resulting in channel downcutting.
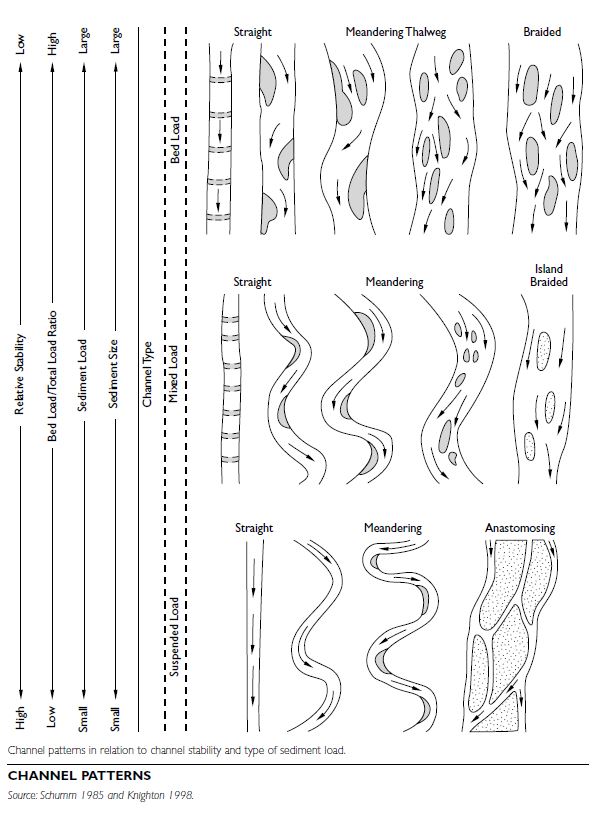
Channel Patterns
Though often thought of as separate entities, the channel and floodplain function as a unit; the flood- plain accommodates overflow from the channel. Natural channel patterns range across a broad spec- trum, including straight, meandering, braided, multichannel (anastomosing), and wandering, which is a transitional pattern between braided and meandering. Sinuosity, the channel length divided by the straight-line valley length, a ratio of channel length over valley length, is a useful indicator of channel pattern.
Channel Cross Sections
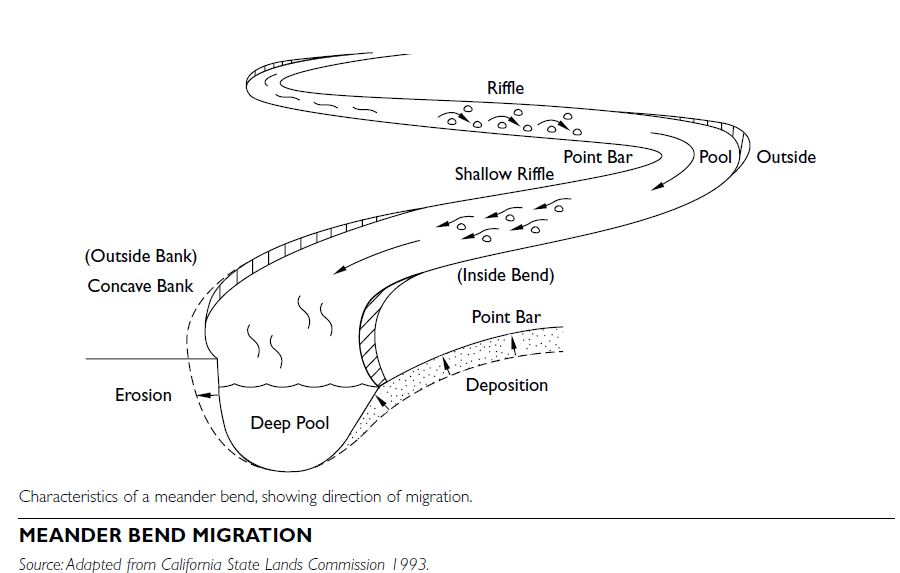
Cross sections across the channel transverse to the flow direction are commonly used to illustrate channel form. Monitoring programs use level surveys of cross sections to document channel changes over time. They are also important data for computer models and are used to predict flow through river channels and estimate flood capacity. Natural channel cross sections are usually asym- metric, with the deepest point in the channel cross section, known as the thalweg, on the outside of bends and a shallow depositional area on the inside of the bend.
Meandering Channels
Channels naturally migrate and change their course. Meandering channels do so by eroding the outsides of meander bends, while building up the point bars on the inside of the bends. Understanding the dynamic nature of river channels can help in predicting areas at high risk of channel erosion.
Bankfull Flow
Most of the time, river and stream channels are only partly filled with water. Many streams in humid climates and those carrying runoff from melting snow commonly experience flows reaching the tops of banks, called the bankfull flow, with a return interval of every 1.5 to 2 years (Leopold et al. 1964). The bankfull flow is widely considered to be the channel- forming discharge, and the 1.5- to 2-year flow is often referred to as the bankfull flow. However, the actual return intervals for bankfull vary widely (Williams 1978). In drier regions, the flows responsible for shaping channels are likely to be larger and less frequent events (Wolman and Gerson 1978).
Wetlands have become a centerpiece of environmental planning efforts in the United States due to their limited protection under the federal Clean Water Act and many state laws. Historically, wetlands were considered sites of disease or as obstacles to human progress, but later studies showed that they have important purposes, such as providing wildlife habitat, serving as filters of groundwater, and aiding in flood control. Unfortunately, more than half of U.S. wetlands have been lost since colonial times, mainly due to agricultural conversion; many wetlands that remain have been seriously degraded.
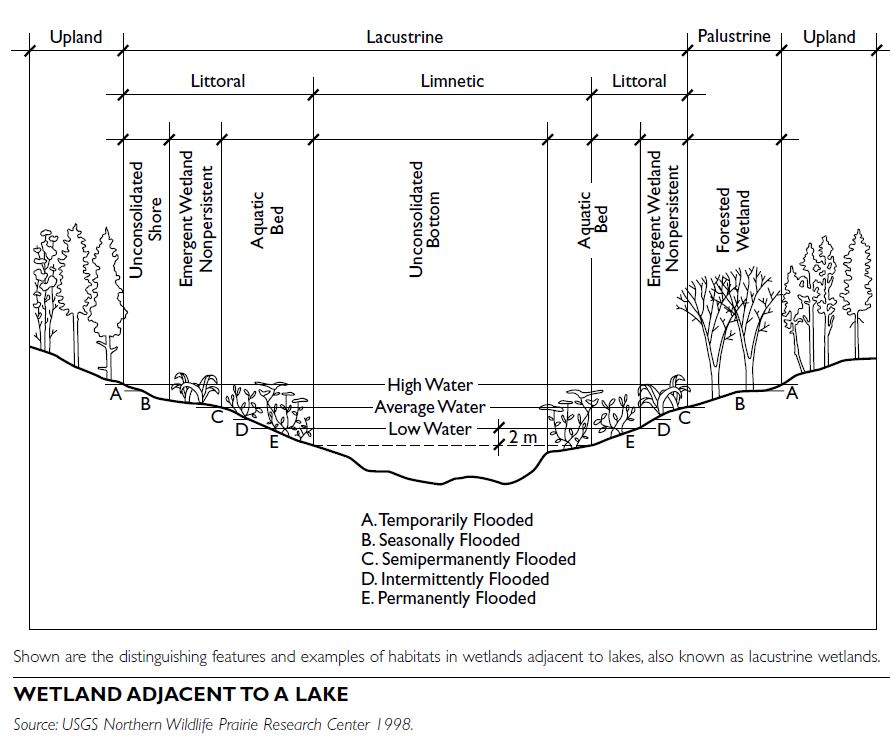
Wetlands are difficult to define and to classify because they are highly variable. This variability is due to local and regional differences in hydrology, soils, vegetation, geology, topography, climate, and the relative degree of disturbance. The regulatory definition, however, requires that they generally meet three criteria. First, wetlands must have water (hydrology) covering the soil or present either at or near the surface of the soil during all or part of the year including the growing season. Second, wetland (hydric) soils must be present. Hydric soils develop under conditions of submergence and low oxygen. Third, wetland-adapted plants (hydrophytes) must be present during at least part of the growing season.
CLASSIFICATION OF WETLANDS
The following is a simplified classification of the major kinds of wetlands.
Marshes
Marshes are among the most easily identified wetlands. They are characterized by emergent soft-stemmed vegetation adapted to saturated soil conditions. There are many different kinds of marshes, ranging from prairie potholes to the Everglades, coastal to inland, freshwater to saltwater. All types receive most of their water from surface water, though many marshes are also fed by groundwater. Nutrients are plentiful, and the pH is usually neutral, leading to an abundance of plant and animal life.
Nontidal Marshes
Nontidal marshes are the most common and widely distributed wetlands in the United States. They frequently occur adjacent to lakes, ponds, rivers, and streams, but also appear in poorly drained areas where surface or groundwater can collect. Water levels in these wetlands generally vary from a few inches to a few feet and may occasionally become completely dry. These marshes include playa lakes, prairie potholes, wet meadows, vernal pools, and some fens.
Nontidal marshes are characterized by highly organic, mineral-rich soils of sand, silt, and clay, and by characteristic vegetation (cattails, bulrushes, and reeds, among others), and characteristic wildlife (red- winged blackbirds, herons, and muskrats). They serve to mitigate flooding, trap excess nutrients and pollutants from runoff, and provide habitat to thou- sands of species of plants and animals. The biodiversity of these marshes is generally high.
Tidal Marshes
Tidal marshes are influenced by ocean tides. They occur along most coastlines but are most abundant along the East Coast of the United States and the Gulf of Mexico. Tidal marshes are most often brackish but may be saline (salty) or even fresh. They are characterized by extremely high biological productivity. Tidal marshes help to reduce storm damage to coast- lines; absorb excess nutrients and pollutants before they reach oceans and estuaries; and serve as important sources of food and habitat (for mollusks and crustaceans, among others), as breeding grounds for fishes and invertebrates, and as shelter and nesting sites for migratory waterfowl.
Swamps
Swamps include any wetland dominated by woody plants, such as trees or shrubs. Swamps are characterized by saturated soils or standing water during certain times of the year, highly organic soils, and dominance by woody plants, including both trees (e.g., cypress trees, white cedar, willow, or maple) and shrubs (e.g., buttonbush, alder, or dogwood). Pocosins are swamps in the southeastern United States generally dominated by evergreen shrubs. Swamps are important in flood protection and nutrient removal, and riverine swamps are particularly high in productivity and species diversity. Lowland swamps are often an important source of food and serve as breeding grounds for birds and upland animals.
Bogs
Bogs are characterized by a thick covering of sphagnum moss, spongy peat deposits, and acidic waters. They receive all or most of their water from precipitation, rather than from runoff, groundwater, or surface water, and are low in nutrients.
Bogs can form when sphagnum moss blankets dry land and prevents water from leaving the surface (paludification) or when sphagnum moss grows over a lake or pond and gradually fills it in (terrestrialization). Either way, acidic peat is deposited, often many feet thick. The flora and fauna of bogs generally possess unique adaptations to low nutrients, saturated conditions, and acidic water (e.g., pitcher plants). Like other wetlands, bogs help to mitigate flooding by absorbing precipitation. In addition, bogs support unique flora and fauna.
Fens
Fens are like bogs in that a spongy layer of peat is deposited, but fens receive their water from ground- water and surface water. Because they receive nutrients from sources other than precipitation, fens are less acidic and have higher nutrient levels than bogs, and support a more diverse flora and fauna. Like marshes, fens are characterized by emergent soft-stemmed vegetation (grasses, sedges, and rushes). Fens are most common in the northeastern United States, the Great Lakes region, and the Rocky Mountains, which are generally associated with low temperatures, short growing seasons, ample precipitation, and relatively high humidity.
Like other wetlands, fens help to mitigate flooding, to remove nutrients and pollutants from surface waters, and to provide habitat for unique flora and fauna.
PLANNING AND DESIGN STANDARDS
Planners are likely to encounter wetland issues in at least three different situations. First, existing, natural wetlands are often an important part of a landscape, and planners must be aware of ways to design devel- opment to minimize impact. Second, existing wetlands may be degraded such that significant wet- land restoration is an important part of development planning and design. Third, there may be a need to construct wetlands where none exist, requiring a careful balance of wetland standards with other design standards.
Planners and developers should, at a minimum, follow these practices when development will affect a wetland:
It is important to remember that proper planning and design will make wetlands important amenities benefiting an entire community.
Much of the world’s coastline consists of sandy beach and dune systems. Beaches can be simply defined as “unconsolidated deposits of sand and gravel on the shore” (Bird 1996). Beaches are found along barrier islands and on mainland coasts. According to a recent study by the Heinz Center, sandy beaches comprise approximately 16 percent of the U.S. coastline, or 6,000 linear miles.
Healthy intact beach and dune systems provide extensive aesthetic and recreational benefits. They also serve as an important form of natural hazard mitigation. Dunes serve as natural seawalls, providing considerable protection to property located landward of them. Beach and dune systems are also major buffers to wave and storm activity.
Beach and dune systems can be defined as transitional ecosystems—lying at the interface of marine and terrestrial environments. These systems serve as important natural barriers to flooding. They are subject to a complex and dynamic sand transport system. They are constantly in flux, affected by the littoral sand “budget” (the long-shore current that moves sand along the beach), delivery of sand mate- rials from fluvial and river sources, and human alteration of the shoreline (such as the construction of a seawall).
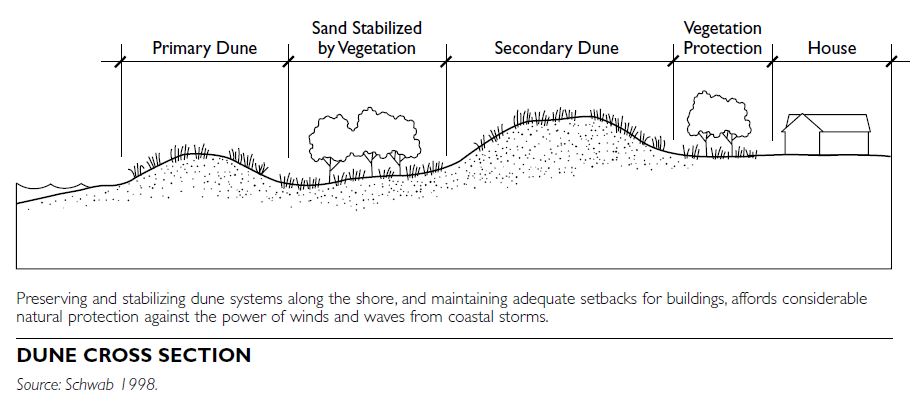
Beaches generally extend from low tide landward to the dune structure or the first line of vegetation. Dunes represent accumulated areas of windblown sand, typically stabilized through vegetation. Extensive systems of dunes exist along virtually every segment of U.S. coastline. For example, extensive dunefields exist along the Oregon coast and the Great Lakes shoreline. Along with offshore sand bars, dunes constitute sand reservoirs that accrete or erode depending on storms, wave action, and human alteration.
CHARACTERISTICS
Beaches can consist of many different kinds of mate- rials, including sand, pebbles, and stone. Gravel and stone beaches are common in northern latitude shorelines, the result of glacial deposits. Sand, the common beach material along most of the U.S. coast- line, is composed primarily of quartz. The size of the sand particles strongly influences beach slope—the coarser the grain size, the steeper the profile; the finer the sand, generally the flatter the beach. At any given time, beaches are stable, eroding, or accreting. In the longer term, most U.S. beaches are eroding and moving landward, primarily in response to long-term rise in sea level.
HABITATS
Dunes and dunefields provide important habitat for many species. Along the California coast, these include rare butterfly species like the Morro Blue but- terfly, deer mice, and black legless lizards. Along the East Coast, they are important habitats for the piping plover and many other shore birds. Beaches, moreover, provide essential habitats for nesting sea turtles and a rich diversity of aquatic organisms.
ELEMENTS OF BEACH AND DUNE SYSTEMS
The beach zone generally extends from offshore, where source materials from sand bars are often located, to inland areas such as maritime forests and habitats lying beyond the dunes. The fore dune, or primary dune, marks the seaward extent of dune-stabilizing vegetation. The beach berm is the area of dry sand seaward of dunes and landward of the beach face. It is the portion of the beach most used and enjoyed by visitors (Rogers and Nash 2003). Dunes consist of a ridge of elevated sand lying parallel to the coast. The base of the primary dune is typically a distance of about 100 feet from mean high water. Secondary or tertiary dunes lie landward of the primary dune.
Beach and dune systems change with the seasons and in response to storm activity. Surge and wave action from hurricanes or storms erode and modify the dune face and beach profile, moving much sand offshore. Dunes are essentially sand storage mechanisms. Over time, much of this material will return to the dune and beach face, though some may be lost from the location entirely. Along the U.S. coast, beaches tend to erode extensively during the high wave-energy period of winter months, then accrete during the summer months.
An estuary is a transitional aquatic zone, the area between freshwater river systems and open ocean.
Estuaries generally involve the mixing of freshwater from rivers and river systems with saltwater from oceans. Of the more than 100 estuaries in the United States, major examples include the Chesapeake Bay, Galveston Bay, Albemarle-Pamlico Sound (in North Carolina), Narragansett Bay, and Puget Sound.
BENEFITS OF ESTUARIES
Estuaries are highly productive ecosystems. They provide important habitat for some 75 percent of the nation’s commercial fish, as well as for migratory birds and other wildlife. Estuaries also filter pollutants and provide buffers to storms and flooding. According to Restore America’s Estuaries, the economic value of commercial fish catch in estuaries is estimated at more than $100 billion per year, providing some 28 million jobs.
ESTUARY CLASSIFICATION BY GEOLOGIC FEATURES
Estuaries can be classified according to their geological features and origins. Four types of estuaries can be identified this way: flooded river valleys (or drowned river valleys), tectonic estuaries, fjords, and bar-built estuaries.
ESTUARY CLASSIFICATION BY MIXING AND CIRCULATION
Estuaries are also commonly classified according to the extent and nature of the mixing and circulation of freshwater and saline water. Three types of estuaries are commonly identified in this way: stratified, par- tially mixed, and fully mixed.
The precise mixing of freshwater and saltwater in an estuary is a function of many factors, including wave action and the extent of seasonal changes in river flows and wind patterns. Estuaries are highly affected by sediment transport and can also be classified according to the relative influence of river flow, wave action, and tidal action (river-dominated, tide-dominated, and wave-dominated estuaries; see Davis 1994).
ECOLOGICAL ZONES
Estuaries are composed of several important habitats or ecological zones. These include transitional lands on the margins of the estuary, which are often the most ecologically productive. Salt marshes and inter- tidal flats, especially, perform critical biological and environmental functions by filtering pollutants, reducing shoreline erosion, absorbing floodwaters, and providing critical habitat and food sources for birds and wildlife, among others. These are areas that generate high primary productivity from plant growth and serve as important exporters of organic matter.
Other important estuarine habitats include oyster reefs and sea grass meadows (submerged aquatic vegetation, or SAV). These habitats, which are always submerged, provide important nursery grounds for fish and aquatic life, refuge from predators, and nutrient banks, and help to oxygenate and stabilize estuarine sediments. Open bay waters and benthic (or sea floor) habitats are also important for many species, including flounder and shellfish, as well as a variety of invertebrate species.
Any estuarine ecosystem also consists of the critical upland areas of rivers and streams, riverine wetlands, and forests. Maintaining these habitats is essential for ensuring water quality downstream and for understanding that the ultimate health of estuaries depends on a complete watershed perspective.
PRESSURES AND THREATS
These highly productive ecosystems face numerous threats. Many U.S. estuaries have already been heavily altered. For example, more than 90 percent of the wetlands that originally existed along the San Francisco Bay are now gone. Galveston Bay has lost 70 percent of its sea grasses. In the Chesapeake Bay, some 90 percent of the sea grass meadows have been lost, and oyster harvests there have experienced a major decline, from 25 million pounds in 1959 to 1 million pounds in 1989.
Excessive nutrient loadings, especially nitrogen and phosphorous, are major problems in many estuaries. Major sources of these nutrients are runoff from farm fields, urbanization, airborne sources from car and truck emissions, and discharges from older municipal sewage treatment plants. Sea-level rise, which may especially raise winter water temperatures, is also likely to have significant ecological effects—shifting the range of certain aquatic species and making estuaries more subject to invasion by nonnative species (Bosch, Field, and Scavia 2000).
PROTECTION AND MANAGEMENT
Federal
The federal government has actively sought to con- serve and protect the nation’s estuaries. Under the federal Coastal Zone Management Act (CZMA), the National Estuarine Research Reserve System (NERRS) was created. Intended to protect representative samples of estuarine ecosystems, 26 reserves covering more than 1 million acres have been designated (National Oceanic and Atmospheric Administration 2002). Another important initiative, the National Estuaries Program, has funded substantial estuarine research and the development of Comprehensive Conservation and Management Plans for 17 U.S. estuaries. These management plans, developed through extensive participation and work with stakeholder groups, serve as “blueprints,” to guide future management policy and planning decisions.
State and Local
Under Oregon’s planning system, Goal 16 (“Estuarine Resources”) requires localities to prepare estuaries plans, consistent with overall development limits established by the state for each estuary. In North Carolina, the Coastal Area Management Act (CAMA) applies significant regulatory standards to estuarine resources, including restrictions on the alteration of coastal marshes, development setbacks along estuarine shorelines, and limits on the size of docks, marinas, and other projects affecting estuaries.
Estuaries sometimes extend beyond state boundaries, requiring multistate strategies. The Chesapeake Bay drains a watershed of 64,000 square miles, for instance, and is affected by activities in four states and the District of Columbia. Consequently, a unique cooperative interstate compact—the Chesapeake Bay Agreement—was entered into in 1983 and has been reratified several times. It establishes a set of management and conservation targets for all parties. The most recent agreement, in 2000, lays out some ambitious goals—all to be met by 2010—including those with major land-use and community planning implications:
• Permanent protection of 20 percent of the land base of the watershed • Cleanup and restoration of 1,050 brownfield sites • Restoration of an additional 25,000 acres of wet- lands • Expansion of the riparian forest buffer by 2,010 miles
LAND USE AND DEVELOPMENT PRACTICES
Modifying land-use and development practices in the watersheds that drain into estuaries must be a key planning strategy in protecting estuaries. During the development process, planners and developers should take steps to reduce the extent of impervious surfaces and to use a variety of low-impact develop- ment techniques, such as rain gardens, bioswales, tree planting, and green rooftops. Conserving existing wetlands and natural habitat and encouraging new farming techniques that reduce organic and chemical runoff (e.g., agricultural buffers, planting of perennial crops, crop rotation) are also important steps. Because many estuaries have already been highly altered, restoration is an equally important goal. Converting farmland back to forests and wetlands, restoring upland fish passages, restoring sea grasses and oyster beds, and cleaning up contaminated port and industrial lands are all valid actions
Slope, relief, and aspect all relate to the topography of a land surface. Knowing how the land surface elevation varies across a site is useful for site design and land protection.
SLOPE
Slope is the rate of change in elevation between two points in a given area. Slope is measured by:
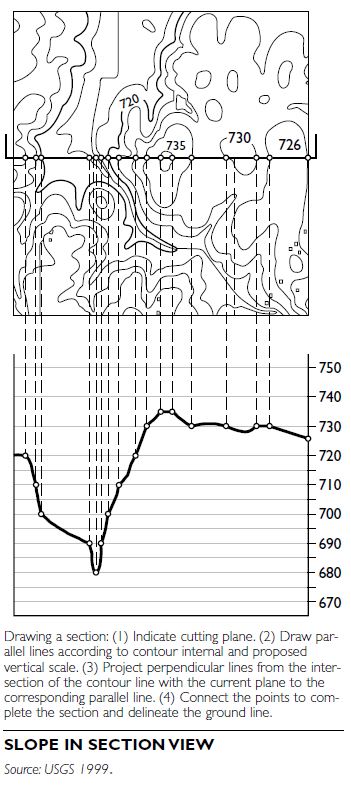
The difference in height (“rise over run”) can be determined from surveyed points or estimated from the contour lines on a topographic map. This calculation yields a number between 0 and 1, which is often converted to a percentage. A slope of 1 (or 100 percent) implies a vertical drop. A slope of zero (or 0 percent) implies a completely flat surface.
Slope must be known to properly design roads and structures and to evaluate the stability or extent of potential erosion at a site. Roads need to be designed so that the slope is not too steep. Many state or town regulations specify a maximum slope. (Check local regulations for the maximum slope allowed.) The maximum slope is often between 5 percent and 10 percent. To achieve this, site grading may be required; this involves either removing or adding soil (cutting or filling) to create the proper slope.
It is also necessary to know a site’s slope to design appropriate revegetation plans to hold soils in place after final grading is complete. In steeply sloped areas, an erosion control fabric is often used to retain soils until the vegetation takes hold.
RELIEF
Relief expands on the concept of slope. It refers to the overall changes in topography on a site or a particular region.
Relief is defined as the vertical difference in elevation between highlands and lowlands in a given region.
A relief map represents the changes in topography. They are often created by shading the areas between contours on a topographic map. The thinness or thickness of these shaded areas implies how quickly the topography is changing. The less distance between the contours, the faster the relief is changing, and the greater the slope of the land. Relief maps can be created in three dimensions to depict changes in topography as changes in height of the map surface
A geographic information system (GIS) software package can be used to readily develop a relief map. These maps are often created as digital elevation models, which are developed by creating a grid across a particular area, designating an elevation for each cell in the grid, and calculating the change in elevation between grid cells. A digital elevation model can be used to calculate and remap changes in the land surface elevation caused by proposed site grading.
Relief maps are often used to evaluate the pathways for existing or proposed drainage through a water- shed or across a site. As shown on a relief map, runoff flows downhill, perpendicular to the topographic con- tours. Runoff erosion is typically greatest in the steepest slope areas, where water will be traveling the fastest. Relief maps also depict the areas with the high- est elevation. This information can be used to evaluate the view from a particular site and to determine how development along the top of a slope or ridge will affect the view from areas further downslope.
ASPECT
Aspect is the direction in which a sloping land surface faces relative to the cardinal points, such as southern aspect and northern aspect.
It is measured in compass degrees. An aspect of 90 degrees means a sloping hillside faces due east. An aspect of 180 degrees describes a south-facing slope.
Aspect maps are maps of selected aspect categories, which are broken down further into southwest, south- east, northeast, northwest, and so on. When site topography data are available, aspect can be readily calculated and mapped in a GIS software package. Aspect maps are constructed on the basis of contour line data, not slope data. Aspect change is measured relative to the change in direction of contour lines.
The interaction between aspect, slope, and relief changes microclimate conditions. Aspect is useful in evaluating solar orientation for maximizing passive solar gain for building construction or for evaluating how solar illumination supports or restricts the agricultural use of a property. Knowledge of aspect is also useful for viewshed protection and, for ski-resort design, to understand how the sun or predominant wind patterns will affect the retention of snow on a ski slope, for example.
Soils are unconsolidated sediments originating both from the breakdown of solid rock and from the decay of organic material. A soil must contain nutrients and trace minerals to be capable of supporting plant growth. The mineral component of soils originates from the underlying parent material, which can include rock in sedimentary, igneous, or metamorphic forms, or unconsolidated sediments previously created from rock through alluvial or glacial processes. The type of soil formed from the parent rock depends on how the rock weathers, which is a function of climate, topography, biologic activity, and time.
Soils information is used in a number of planning applications, including agricultural management,resource protection planning (such as for watersheds), site design, wastewater and stormwater management, erosion control, and building/foundation design.
SOIL HORIZONS
The soil formation process creates layers, called horizons, with depths that can be seen in a test hole dug into the ground. Soil horizon mapping is used to create a soil profile. A typical soil profile can have up to six layers extending into the ground, including:
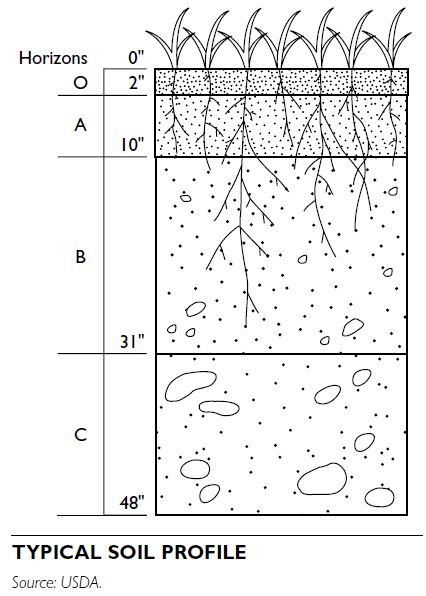
SOIL TEXTURE
Soil texture is the relative proportion of three particle sizes within a particular soil: sand, silt, and clay. Larger gravels or cobbles are also sometimes included. The U.S. Department of Agriculture, Natural Resources Conservation Service (NRCS), formerly the Soil Conservation Service, classifies the sand, silt, and clay particles by specific size ranges. Running a soil sample through a series of sieves and measuring the percentage of materials that passes through mesh of a sieve with a particular opening size can measure the particle sizes. Soil texture can also be identified in the field.
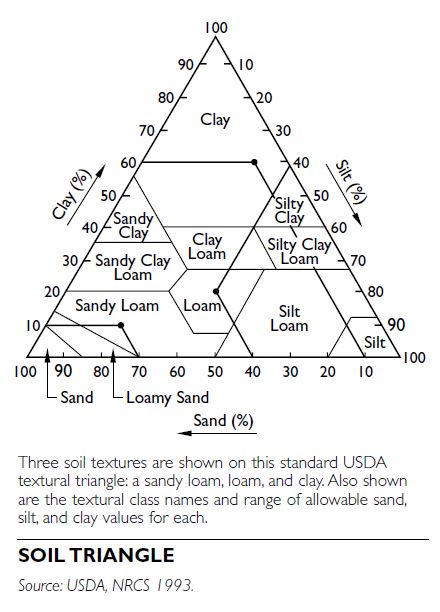 The NRCS has created a soil triangle to provide a standardized way of defining soil texture. A soil that is 100 percent sand, silt, or clay would be defined by one of the three points of the triangle. Mixtures of the three are then defined based on where they fall within the triangle. Clay soils contain a minimum of 40 per- cent clay particles. Loam is a relatively equal mixture of all three particle sizes. Loam soils are further defined by describing which of the three particle sizes is dominant (sandy loam, silt loam, or clay loam).
Soil texture is often used to determine the loading rate for wastewater effluent in the design of on-site septic systems or larger wastewater disposal facilities. It is also commonly used to design stormwater infil- tration facilities.
The NRCS has created a soil triangle to provide a standardized way of defining soil texture. A soil that is 100 percent sand, silt, or clay would be defined by one of the three points of the triangle. Mixtures of the three are then defined based on where they fall within the triangle. Clay soils contain a minimum of 40 per- cent clay particles. Loam is a relatively equal mixture of all three particle sizes. Loam soils are further defined by describing which of the three particle sizes is dominant (sandy loam, silt loam, or clay loam).
Soil texture is often used to determine the loading rate for wastewater effluent in the design of on-site septic systems or larger wastewater disposal facilities. It is also commonly used to design stormwater infil- tration facilities.
SOIL SURVEYS Soils have been mapped for most, if not all, of the United States. The NRCS publishes soil surveys, containing maps and descriptions, for each county or a portion of a county.
Soil surveys provide maps on an aerial photo base map that shows the locations of general, or regional, soil map units. The general map units differentiate soils by major soil groups, created by evaluating the soil texture and grouping similar soils based on local topography and drainage patterns. A map unit contains one or more major soil units and may contain a few minor soil units, such as a small area of isolated wetland soils in an upland soil unit. The general map unit is named after the major soil within the unit.
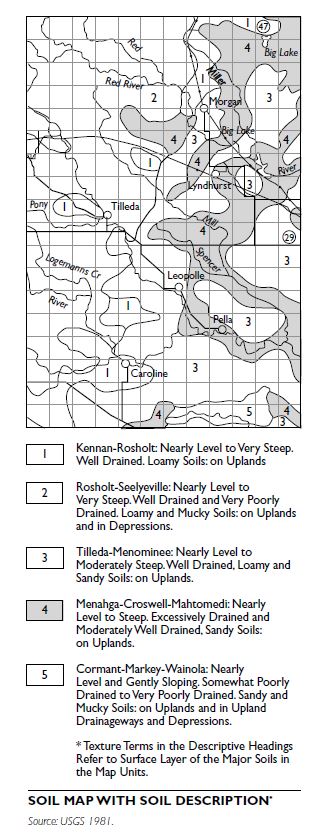
General soil units are also broken down into more detailed soil map units that provide soils data on a more localized scale. These detailed map units are named, and a description of the soil is provided that explains soil composition, profile depth, and slope.
The NRCS soil surveys provide a wealth of data on the suitability of individual soils for a variety of uses, including agriculture, forestry, wildlife habitat, site development, wastewater disposal, landfill, use in con- struction materials, such as gravel mining and cement production, and water management. Therefore, the soil survey is worth reviewing for most planning stud- ies, both at the watershed scale and site scale.
SOIL MECHANICS
An understanding of soil mechanics, the evaluation of the mechanical properties of soils, is needed for proper site design and construction. The soil survey provides a first cut at this information, but, often, detailed, site-specific information is needed because soil texture can vary over short distances or at depth. Testing can include on-site test pits to map soils and in situ or laboratory analysis of their mechanical properties.
The two main soil mechanics issues are the compaction, or settling, of soils and their shear strength. Both of these are affected in part by the percentage of water within the soil matrix. This is especially true for clay soils.
Compaction
The weight of a structure, such as a building, road, or dam, can cause the underlying soils to compact and settle. These changes need to be considered to properly design the building to avoid settling problems. Laboratory tests of undisturbed soil samples can be used to estimate the extent of compaction. In addition, soil borings and sampling techniques can be used to estimate the density of soils and the potential for additional compaction or settling.
Shear Strength
The shear strength of a soil is its capability to resist a force acting at right angles to the soil formation. Understanding the shear strength is important in understanding the stability of a slope and the potential for soils to erode or fail catastrophically, especially where cuts or fills are proposed to change the existing topography. It is also important for structure design where the land is sloped and where the weight of a building or other structure can cause the soils to fail, potentially undermining the structure.
Shear strength is a function of both frictional resistance and the cohesive strength of the soils. Soils consisting of round particles will have less frictional resistance than flat or angular particles, which tend to interlock with each other and have more friction between them; they will remain more stable on a steep slope when additional weight is placed on top of them. Also, clay particles are electrically charged, and a strong bond can form between them, making them more cohesive than sandy soils and therefore resistant to compaction or movement. However, as clay soils become wet, the presence of water reduces their cohesive strength. Shear strength can be determined through laboratory tests, such as a direct shear or triaxial compression test. In these tests, an undisturbed sample of the soil is pressurized and the amount of pressure needed to cause the soil to fracture or break apart is determined.
OTHER SOIL QUALITIES
A soil can exhibit dry, plastic, or liquid qualities, depending on the extent of water present. If soils are moist, they are plastic, and if deformed will retain their new shape. If too much water is added, soils behave as a viscous liquid. The plastic limit forms the boundary between solid (dry) and plastic soils, and the liquid limit represents the point at which a soil begins to behave as a liquid. These limits have been named Atterberg limits for the Swedish scientist who created the classification process. Clay soils that exhibit plastic properties are difficult to use in construction materials. In addition, clay soils tend to shrink and swell based on the amount of water they contain, creating further problems for siting struc- tures. Buildings, bridges, or dams built on clay soils often need deeper footings to offset the shrink/swell properties of the clay, or require other design features to control the amount of water within the clay.
The water retention capability of a soil is also important in cold climates, where frost heaves can be formed. These are areas where soils expand and shift as they freeze as a result of the expansion of water as it freezes within the soil. Roads are typically constructed over a gravel or sand base that will not retain water and will minimize the damage caused by frost heaves. Building foundations and footings are also set below the frost level to reduce shifting of the structure caused by soil expansion in the frost layer.
In arid regions of the country, soil surveys can provide information on the water retention of a soil useful for irrigation planning for agriculture or turf management. They provide data on a soil’s capability to adsorb or leach salts, which can affect plant productivity, the infiltration rate of the soil that will control the rate of irrigation water application, and the slope of the land surface that will control the extent of erosion caused by the irrigation water.
The protection of biodiversity, or the total variety of life and its interactions, has become a major environmental challenge for planners. Conservation biologists emphasize that biodiversity must be protected at three levels: species diversity, genetic diversity, and ecological or ecosystem diversity.
THE VALUE OF BIODIVERSITY
Biodiversity is generally accorded high value because it benefits ecosystems in ways that positively affect human health and well being. For example, healthy natural ecosystems help to provide fresh air, clean water, and productive soils. Furthermore, natural products, such as foods and medicines, result from healthy biodiversity, which leads to benefits that maintain a healthy economy. The natural beauty of healthy ecosystems supports recreation and improves the quality of life.
Unfortunately, all indications suggest biodiversity is being rapidly lost, both in the United States and worldwide. Many factors probably contribute to dwindling biodiversity, but habitat loss and fragmentation due to human impact and introduction of nonnative species of plants and animals are among the most important.
EXISTING LEGAL REMEDIES TO THREATS TO BIODIVERSITY
Legal protection of biodiversity is limited. The federal Endangered Species Act (ESA) makes it unlawful for any person to “take” an endangered species or to damage the species’ “critical habitat.” Other federal laws, such as the Marine Mammal Protection Act, offer protection to specific groups of animals and plants. Most states have their own version of the ESA, which often provides protection to additional species. A few states have developed biodiversity protection programs. For example, California’s Natural Communities Conservation Planning Act provides a measure of protection for valuable ecosystems and their associated biodiversity. In addition, all state fish and wildlife agencies are now engaged in completing comprehensive wildlife conservation strategies under the new State Wildlife Grants program. Each state is charged with completing a strategy by October 2005. The intent of these plans is to address wildlife habitat needs before species require listing under the Endangered Species Act. Many statewide biodiversity planning efforts are being connected to these wildlife strategy efforts.
At the international level, the Convention on Biological Diversity (CBD) was designed for “the conservation of biological diversity, the sustainable use of its components, and the fair and equitable sharing of the benefits arising out of the utilization of genetic resources.”
WILDLIFE INVENTORIES,WILDLIFE MAPPING, AND HABITAT ASSESSMENT
Before action can be taken to protect and enhance biodiversity, it is first necessary to evaluate the extent of the problem. Landscape ecologists have developed **several useful tools for the purpose, but among the most useful is the wildlife inventory (WI).
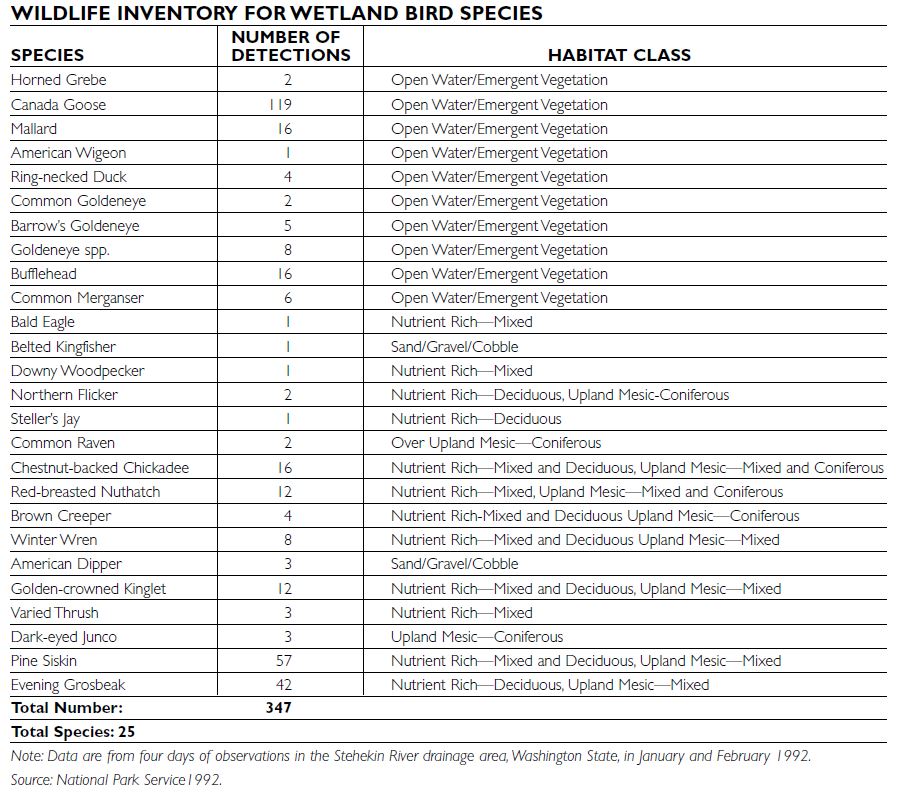
A WI is a comprehensive listing of species of plants and animals in an area, which ideally also provides at least some information on relative abundance of each species. A WI can be a formidable undertaking because it requires a great deal of taxonomic expertise to identify plants and animals and a great deal of time and effort. Many successful WIs have enlisted the assistance of volunteers and community activists who are trained to identify certain kinds of species.
An ideal WI should account for all species of plants and animals in an area as well as for seasonal differences in abundance. Such an accounting is functionally impossible for large, topographically complex areas with many species. As an acceptable alternative, a modified WI may be performed in which only certain key species are identified, such as “keystone species” (i.e., those that are especially important to an ecosystem) or species that are simple to see and count.
Linear Transect
A common WI method uses a linear transect: Surveyors simply identify individual plants and/or animals and count them. Linear transects can be conducted on foot or by vehicle. They usually follow predetermined straight lines, roads, contours, or drainages. Species may be sampled continuously along the transect or at fixed points along it.
Mapping and Gap Analysis
An important part of a WI is the preparation of accurate mapping of the data derived from the transects. Accurate maps of wildlife and vegetation provide the habitat, species, topography, and land management information necessary to protect biodiversity. In many cases, wildlife maps allow examination of wildlife species currently protected by existing public reserves and identify “gaps” (that is, those species and habitats not found on public lands or preserves and therefore requiring protection). Maps can be verified in a variety of ways, including field observation, use of existing covertype maps, and airborne videography.
Gap analysis has become technologically sophisticated, and now can yield several important kinds of information:
With appropriate wildlife inventories and maps, it becomes possible to identify and analyze the most effective means for protecting threatened habitats and species.
Flooding is the overflowing of water upon land not usually submerged. Understanding the probability of a flood is essential in understanding the phenomenon. Factors such as the normal water level for a particular stream or river, and the odds that the water may rise 10 feet, 20 feet, or higher, need to be deter- mined. Terrain is also a critical factor because riverbanks can be high and steep, or there can be flat- lands where the water easily spills out. Also, wetlands function as a critical middle ground between uplands and floodways. In addition, human-made obstructions, such as levees and dams, influence the direction of floodwater movement.
FLOODING PROBABILITIES
Probabilities and topography are at the core of map- ping flood hazards. A 100-year flood is one that has, in any given year, a 1 percent chance of occurring. Even after it occurs, it has the same chance the fol- lowing year. Depending on the location, the term refers to a specific level of inundation as measured by engineers, assuming certain conditions upstream that affect the flow of waters downstream.
However, when new development upstream reduces the amount of pervious surface that can absorb precipitation, more water is then forced downstream, and the probabilities change. A 100- year flood can become a 50-year or 25-year flood, with correspondingly higher chances (2 or 4 percent, respectively) of occurring. These measurements of risk are generally intended to be a means of deter- mining how to regulate land use with flood safety in mind, but the National Flood Insurance Program (NFIP) and local ordinances use the 100-year flood as a regulatory device.
TERMINOLOGY
In addition to the 100-year flood just described, the following floodplain management terms are some essential definitions for planners and urban designers to understand:
Base flood elevation (BFE). BFEs are rounded, whole-foot elevations of the 1 percent (100-year) annual chance flood at selected intervals that have been studied in detail. Communities issuing building permits for structures should refer to BFE, for example, so that living space in residential structures is elevated at or above that level by a specified amount, such as one foot.
Flood insurance rate map (FIRM). A FIRM is a map developed by the Federal Emergency Management Agency (FEMA) to illustrate the extent of flood hazards in the community. It may include risk zones for flood insurance, the 100-year and 500-year floodplains, floodways, base flood elevations, and the physical features of the floodplain.
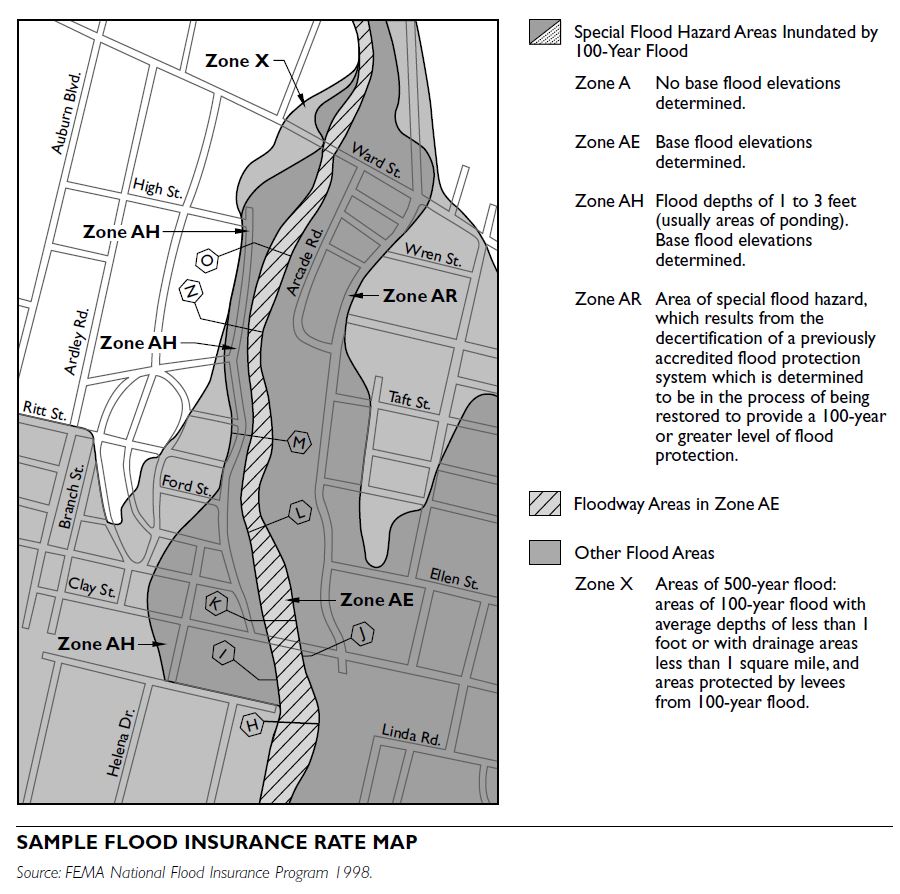
Freeboard. Any additional height above a flood elevation is called the freeboard. A community may use this calculation to determine the required level of elevation for a structure’s lowest floor in accordance with floodplain management regulations, for example.
Regulatory floodway. Also known simply as the floodway, shown on the FIRM, the regula- tory floodway is the channel of a stream and any adjacent floodplain areas that must remain free of encroachment in order to allow the 100-year flood to move downstream without substantial increases in flood heights. Those increases are one foot by federal standards, but local stan- dards can be more stringent.
Special flood hazard area (SFHA). An SFHA is the area included within the 100-year floodplain as shown on the flood insurance rate map.
MITIGATION OPPORTUNITIES
Opportunities for planners to mitigate flood hazards and prevent losses of life and property are extensive, in large part because flood risks are so much more clearly definable for land-use purposes than almost any other hazard. The mapping functions of NFIP provide an effective basis for establishing floodplain management regulations through zoning, subdivision controls, and other measures within clearly defined areas with readily quantifiable risk factors. For existing structures in the floodplain, the two most extensively used mitigation actions are relocation and elevation. Build-out analysis can be used to identify potential increases in floodplain boundaries in order to adapt zoning regulations for mitigation of future hazard threats.
ISSUES FOR PLANNING AND URBAN DESIGN
Federal disaster legislation has steadily been pushing communities toward advance planning for various kinds of natural disasters, flooding included. FEMA now expects communities to develop flood mitiga- tion plans as a condition for receiving federal hazard mitigation grants. Because flood contours can be clearly mapped beforehand, there is a growing awareness that communities can and should also pre- pare predisaster plans that facilitate postflood recovery. Federal and other disaster aid can be used to reduce vulnerability by elevating, relocating, or otherwise mitigating dangers to flood-prone properties. In determining whether they will permit rebuild- ing within designated floodplains, many communities exceed federal criteria for repetitive losses by looking at cumulative losses over a period of time rather than individual flood losses, for example. Multiobjective management involves local governments connecting flood mitigation objectives with plans for floodplain uses, such as greenways, bicycle trails, and other low- impact uses.
CHECKLIST OF FLOOD MITIGATION STRATEGIES
This checklist, originally prepared by L.R. Johnston Associates, divides mitigation strategies into four categories:
1. Modify susceptibility to flood damage and disruption:
2.Modify the impacts of flooding:
3.Manage natural and cultural resources:
4.Modify flooding: